Using the Process Monitor in the Portal
An INUBIT Process Monitor consists of two components: one or more Process Monitor grids and the corresponding dashboards. The following sections explain how you use both components in the portal server.
Using Process Monitor Grids
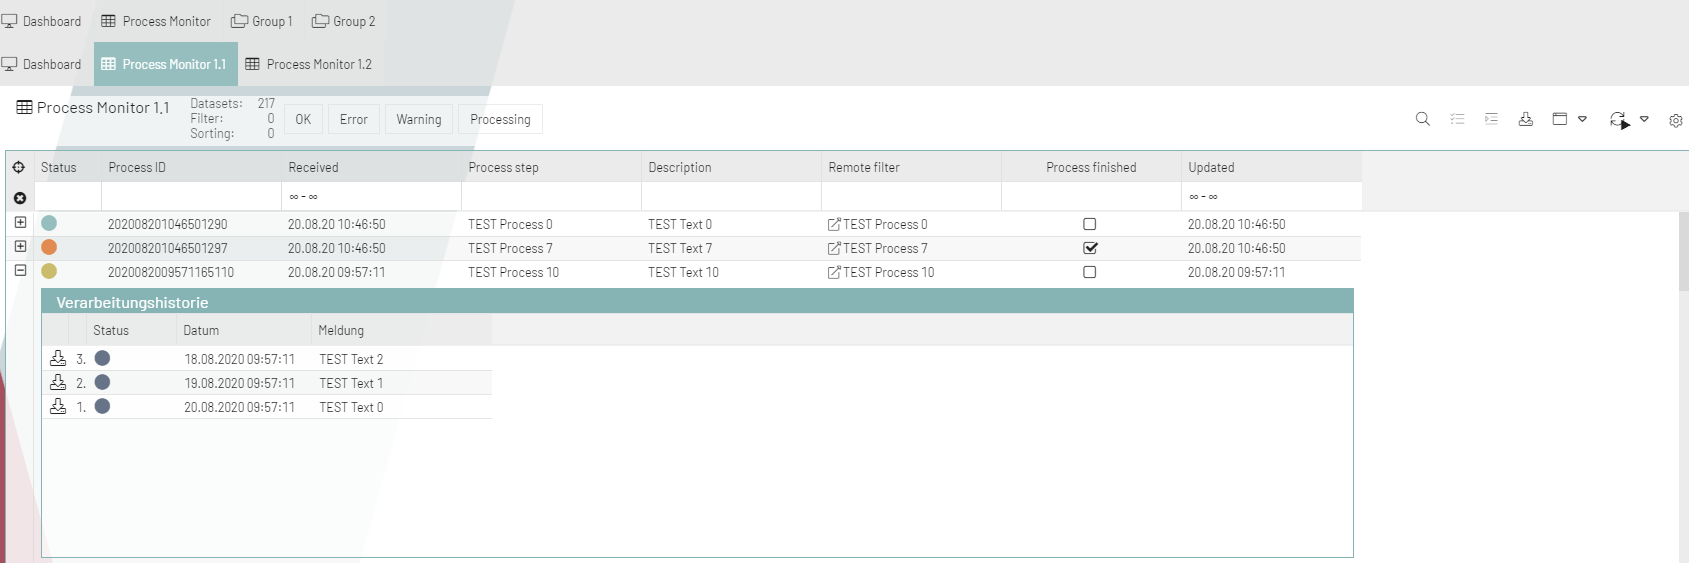
Process Monitor grids enable structured display of logged data from the database in the Process Monitor. The grid clearly displays the entire process history including traffic light status displays. In addition to information about the current progress of the process, it is also possible to call up detailed information by pressing the plus button.
The columns of the Process Monitor grid are defined in the XSLT variable of the BPC_Assign_hook module in the BPC_299_PM_Configuration workflow.
Refer to Adjusting the Process Monitor Grid.
Possible Statuses of Monitored Processes
Monitored processes can have the following statuses:
-
 Error
Error -
 Warning
 -
 OK
OK -
 Processing
You can change the assignment of status values to colors, refer to Changing Status Names and Displays in the Grid.
Parent and Child Entries
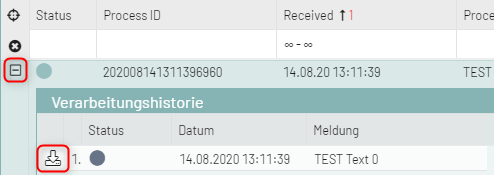
All logged data is displayed in the form of parent and child log entries.
The parent entry is always the first log entry that is created when a technical workflow is executed in connection with the Process Monitor. All subsequent log entries for the same process execution are child entries of the parent entry. In the grid, log entries are grouped so that all child entries are displayed below their parent entries.
Refer to Structured display of log entries.
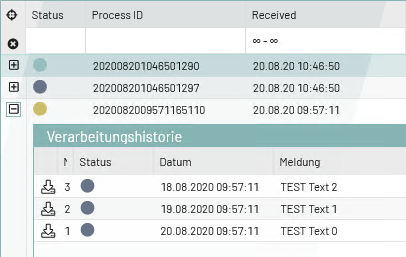
You use the plus and minus buttons to expand and collapse the display of the child log entries. The child log entries are always sorted by ChildID in ascending order:
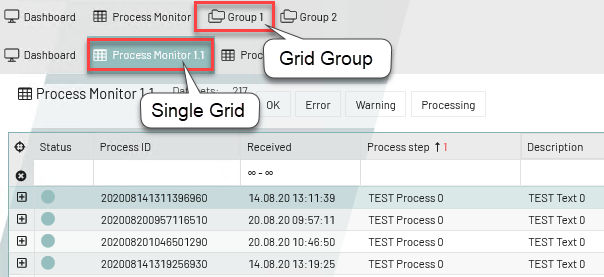
Single Grids and Grid Groups
In the default configuration, the included workflows generate 5 Process Monitor grids; one single grid and two grid groups (with 2 single grids each in sub tabs):
-
Single grids
A single grid contains a single Process Monitor grid with a corresponding dashboard. If desired, you can hide the dashboard.
-
Grid groups
You can combine multiple grids to form grid groups. A grid group can consist of multiple (single) grids and you can decide for each grid group whether the grids should be displayed cascaded or on tabs. For each grid group, the statuses of the individual grids can be displayed together on a common dashboard.
-
Grid Group 1
In the default configuration, contains two Process Monitor grids (single grids) each displayed on their own tab (sub tab 1 and sub tab 2). For the entire grid group, there is a group dashboard as well as a separate dashboard for each grid on its tab.
-
No Tabbed Group
Also contains two Process Monitor grids, but not on separate tabs but cascaded.
-
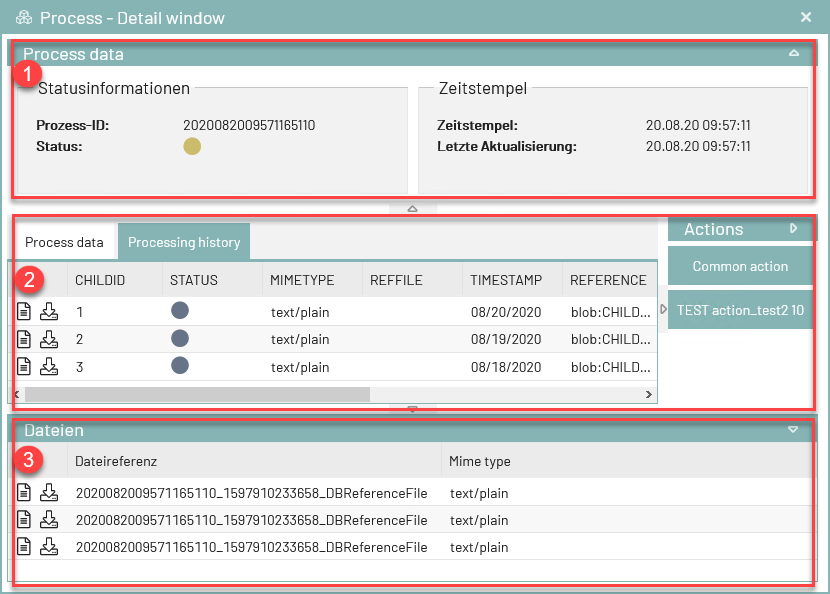
Detail Window
You will get the detailed view to all the information about the processing of the process over the entire life cycle. The detailed view opens with a double click on the corresponding data line of the process.
-
The most important information about the process is listed.
-
The individual process steps are displayed and actions for the process are listed.
-
The displayed files can be downloaded and saved.
Grid Functions
To make it easy to work with the displayed data, the grid provides various functions. The functions are described in the following chapters.
Switching Between Dashboards and Grids
Using the dashboard button, you can switch from the gird view to the desired dashboard and from the dashboard view back to the grid:
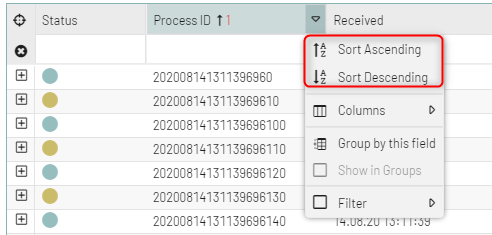
Sorting Parent Log Entries
By default, all parent log entries are sorted by date in ascending order. By clicking one of the commands Sort ascending / Sort descending in the context menu of the column headers, you can sort entries in the selected column in ascending or descending order. The sorting can also be carried out by clicking the column header (for ascending order) or double- clicking the column header (for descending order).
An up or down arrow next to the column name shows whether the column is sorted in ascending or descending order.
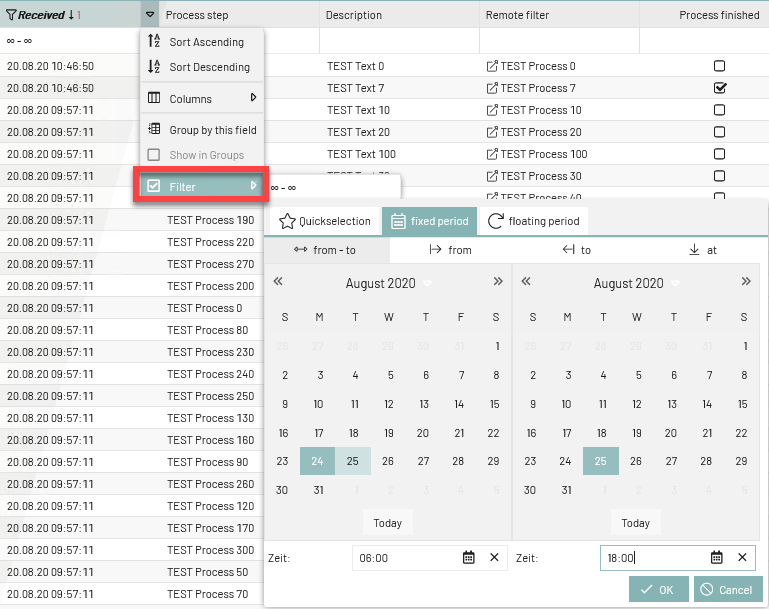
Simple Filtering of Parent Entries
You can filter the displayed transactions according to one particular criterion, allowing you to work with a subset of the data records.
You can filter the parent log entries in the following ways:
-
Using the context menu of the column headers, for example:
-
Using the date and text filters:
The function of these filters works via the context menu of the column headers. The date filter refers to the Date column, the text filter to the
Textcolumn.
|
In the case of simple filtering, the function is NOT case-sensitive. Parts of character strings are also searched without you specifying wildcards. |
Search and Filter
Flexible search and filter options are available in the overview page, making it easy to find the desired data records. To simplify operation for frequent applications, search queries can be saved as favorites and called up again at any time. This is possible both per user and collectively in the team, so that identical favorites are available to all team members. By clicking on a data set, the corresponding detailed view opens, which displays all the relevant technical information.
For ease of use and flexible applicability in different use cases, the interfaces consist of a central search mask for finding the relevant master data and a corresponding detailed display that shows the configured Business Content.
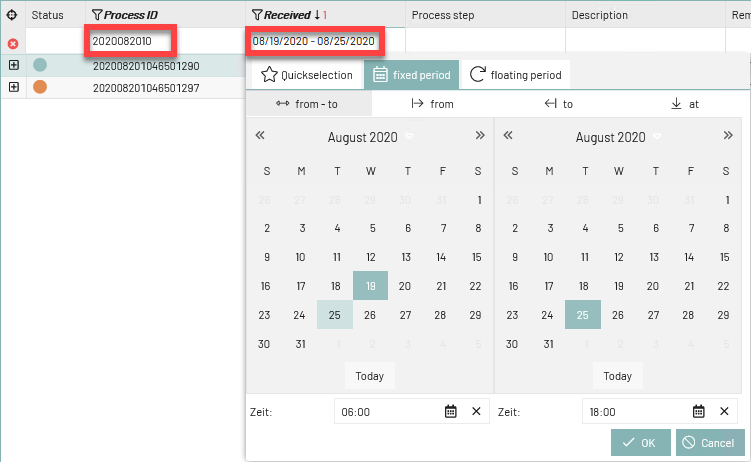
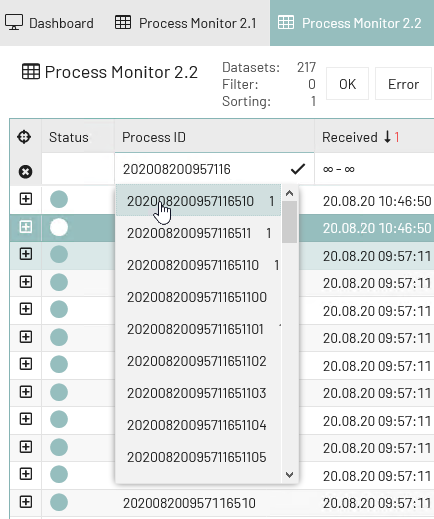
Search and filter options
If you want to filter according to a certain criterion within the processes, you can make the entry in the search field of the respective column. By entering the first letters, filter results are suggested that can be adopted. The selection is accepted by clicking on the check mark.
Save search as Favorites
The selection can be saved as a favorite via Views > Manage views in the top men.
Deleting Filters
If–after filtering–you later want to display all available data records again, deactivate the filter option on the respective column or delete all filters:
-
Deleting filter
To delete a specific filter from a column, remove the check mark from the Filter option in the context menu:
To delete all filters, click the
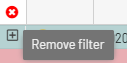 button.
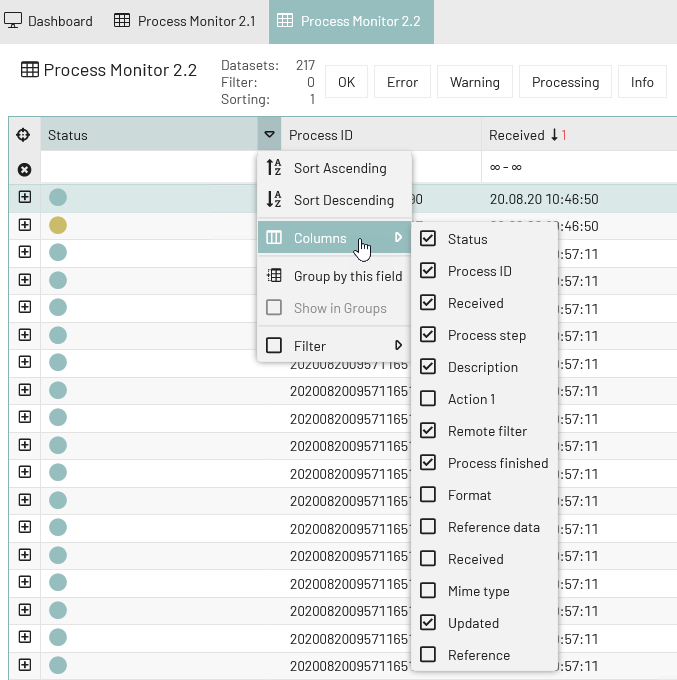
Showing and Hiding Columns
You can use the context menu of the column headers to show and hide columns:
Exporting Parent Entries
Usage
To export the logged parent log entries as CSV/XLSX.
|
Excel 2007 supports a maximum of 65535 lines. To configure the maximum number of exported lines, open the XSLT variable of the |
Prerequisites
You have deactivated your browser’s pop-up blocker.
Proceed as follows
-
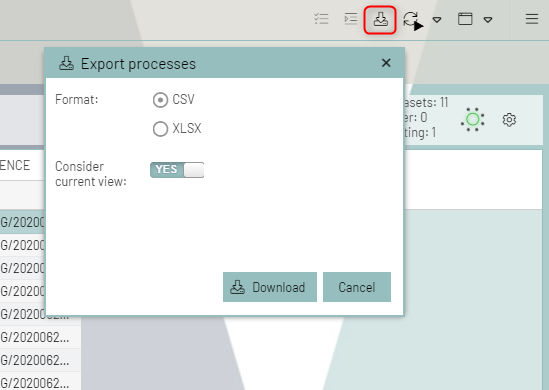
In the Process Monitor grid, click the Export button. A menu opens:
-
Select the desired format:
-
CSV
-
XLSX
-
-
Choose whether to Consider current view.
-
YES: Only data in currently visible columns are exported.
-
NO: All configured columns are exported.
-
-
Click Download to start the export.
→ The data is exported. A dialog opens.
-
Specify whether you want to open or save the exported file.
Displaying Files for Entries
References to files can be saved for parent and child log entries. To display a file, click the download button:
Refreshing the Display of Data
You can manually or automatically refresh the display of the data:
-
Refresh manually:
Below the table, click the
 button.
 -
Refresh automatically:
Select the Auto refresh option below the table. The display is refreshed automatically at specified intervals.
You can configure the interval and hide the option completely by default.
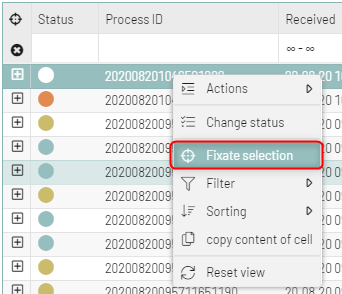
Locking the Data Selection
If you want to restrict the view to a selection of data records or the data records currently displayed, you can fix the view. This function can be found in the upper left area of the table or in the context menu. If data records are selected, this function refers to the current selection. If no data records are selected, the currently visible area is fixed.
The function sets an additional filter on the column with the IDs of the data on the monitor. To reverse the action, simply remove the filter on the corresponding column.
Using the Process Monitor Dashboard
The Process Monitor distinguishes between dashboards for individual grids and group dashboards for grid groups.
For each individual grid that displays a status overview for all log entries (single grid), there is a corresponding dashboard. You also have the option of combining grids to form grid groups and having group dashboard for each grid group.
Dashboards for single grids and group dashboards differ in their types of displays.
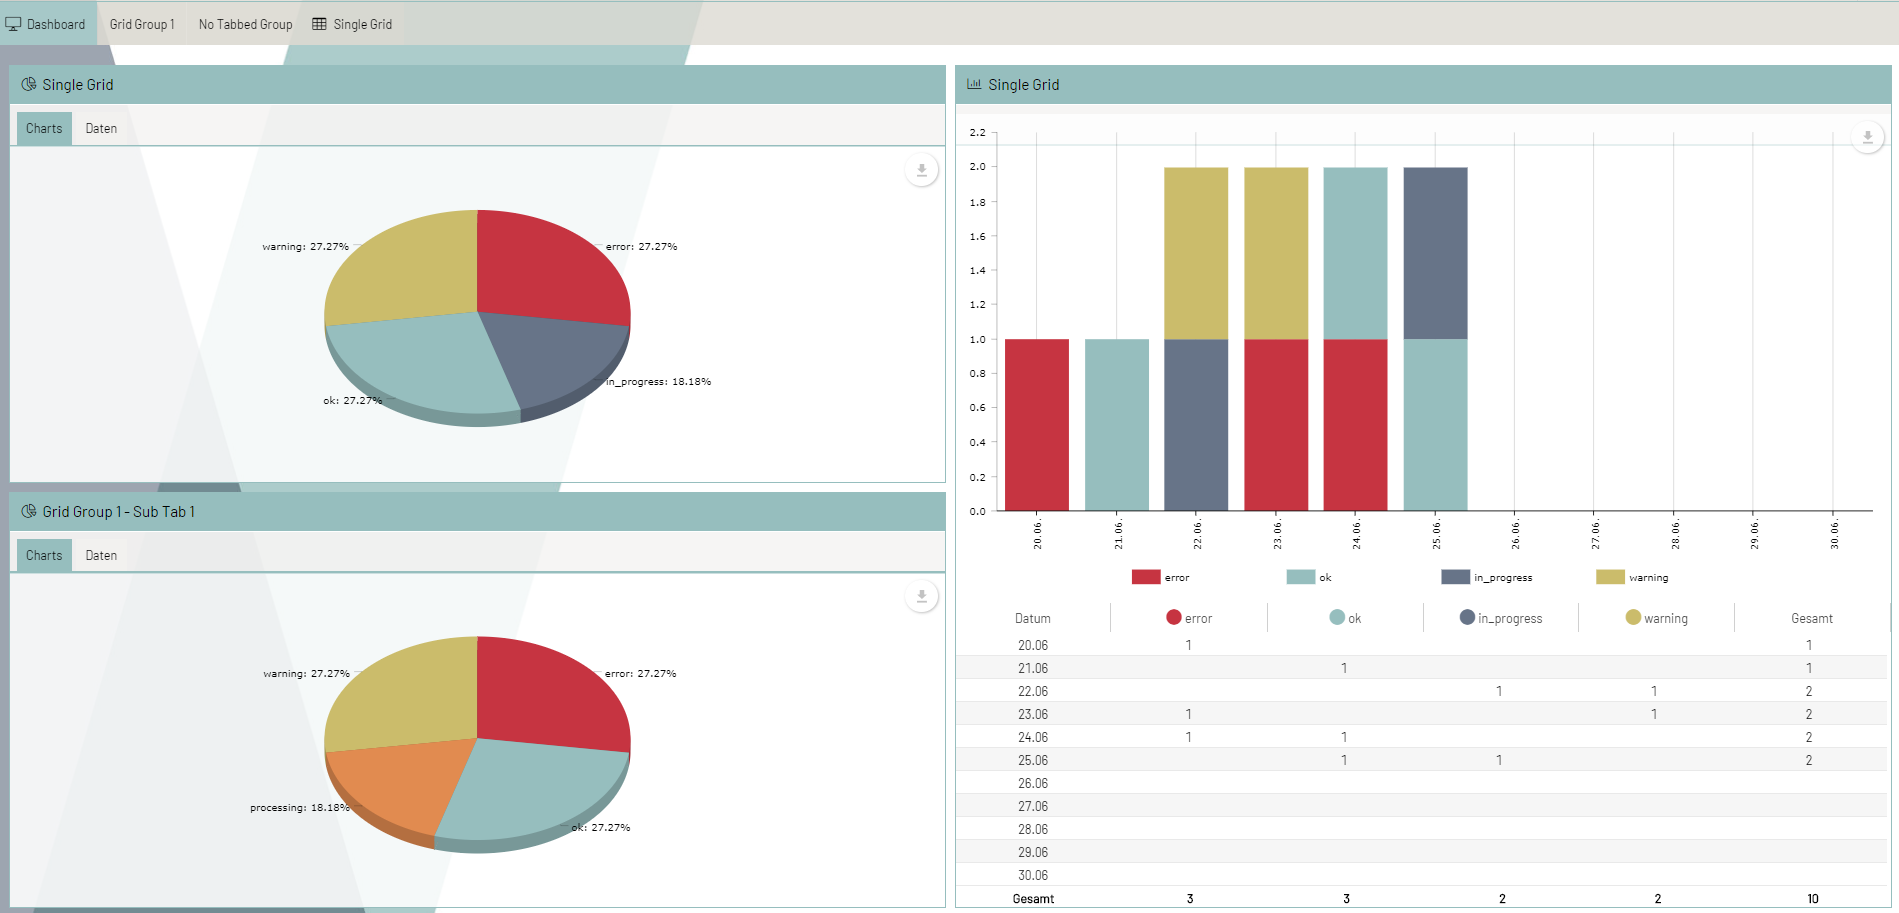
Dashboard for Single Grid
A dashboard for a single grid provides an overview of the status of log entries in the following two display types:
-
Pie chart
The pie chart shows each status’ share of all log entries as a percentage as well as the absolute number.
-
Bar chart
The bar chart shows each status’ share of all log entries as a percentage as well as the absolute number over time.
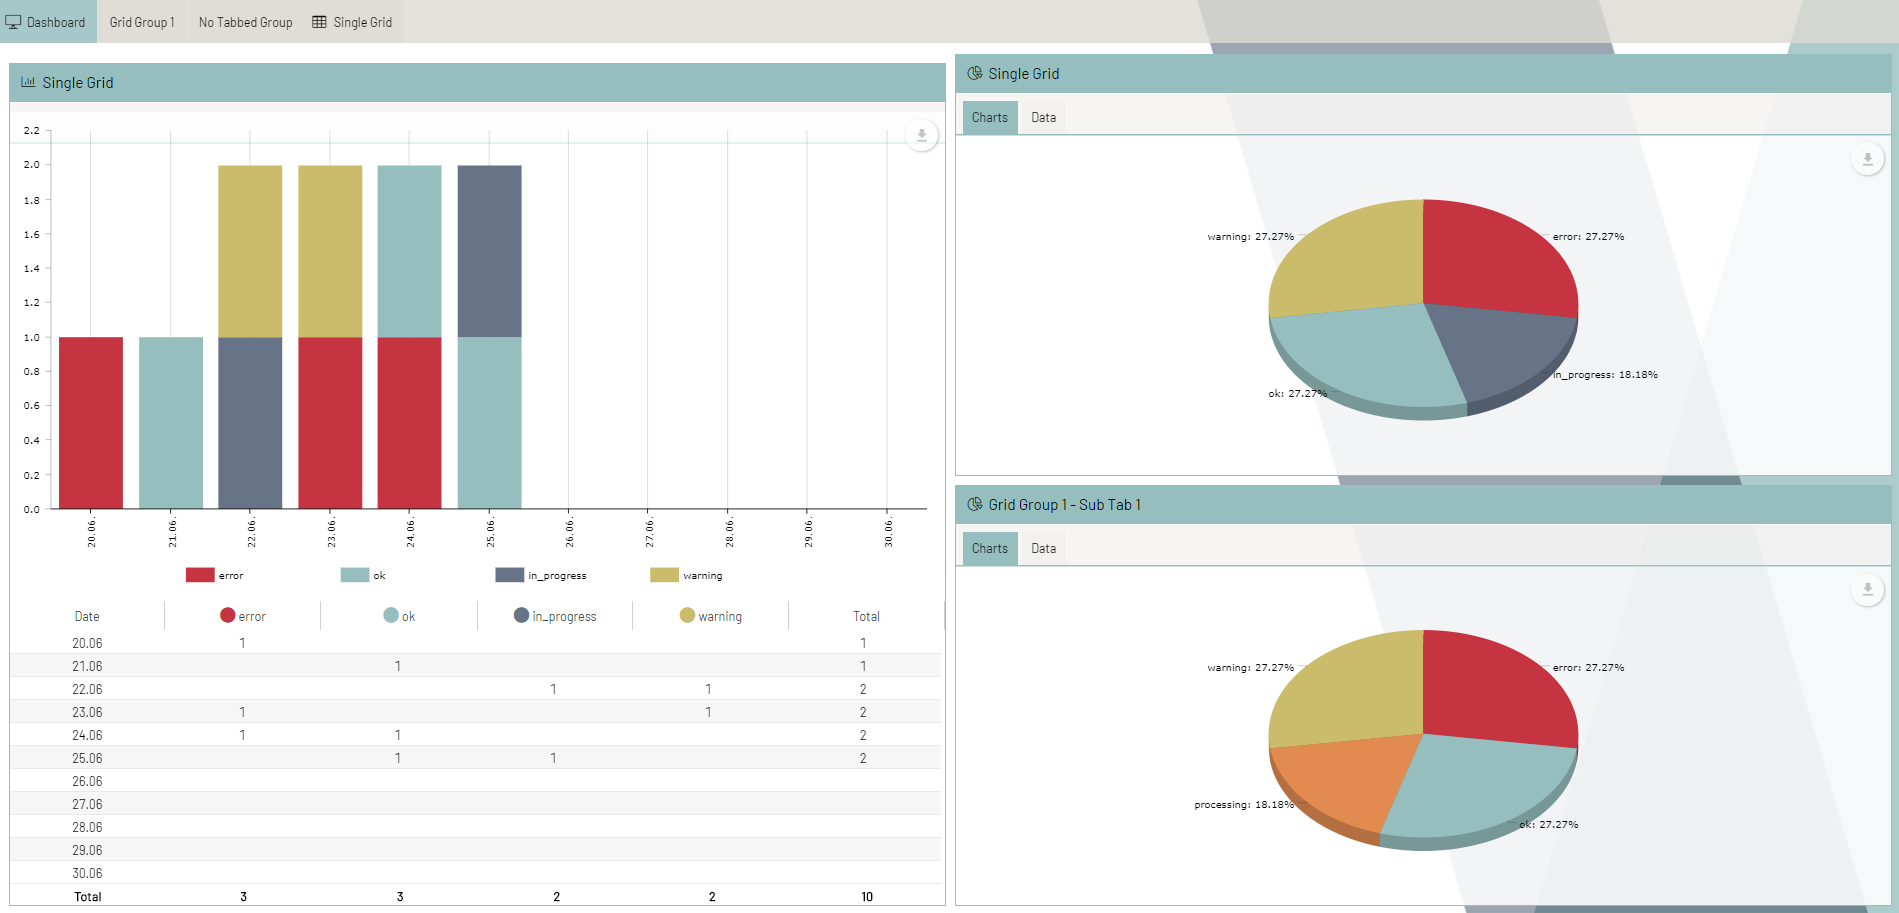
Group Dashboard for Grid Group
A group dashboard for a grid group provides an overview of the statuses of the log entries for the individual grids of the group in the following display types:
-
Bar chart
The bar chart shows each status’ share of all log entries per grid (sub tab) as a percentage as well as the absolute number over time grouped by date.
-
Table
The table
Data of the last 7 daysprovides an overview of the overall data grouped by status category. It shows the absolute number of log entries with each status for each grid in the group.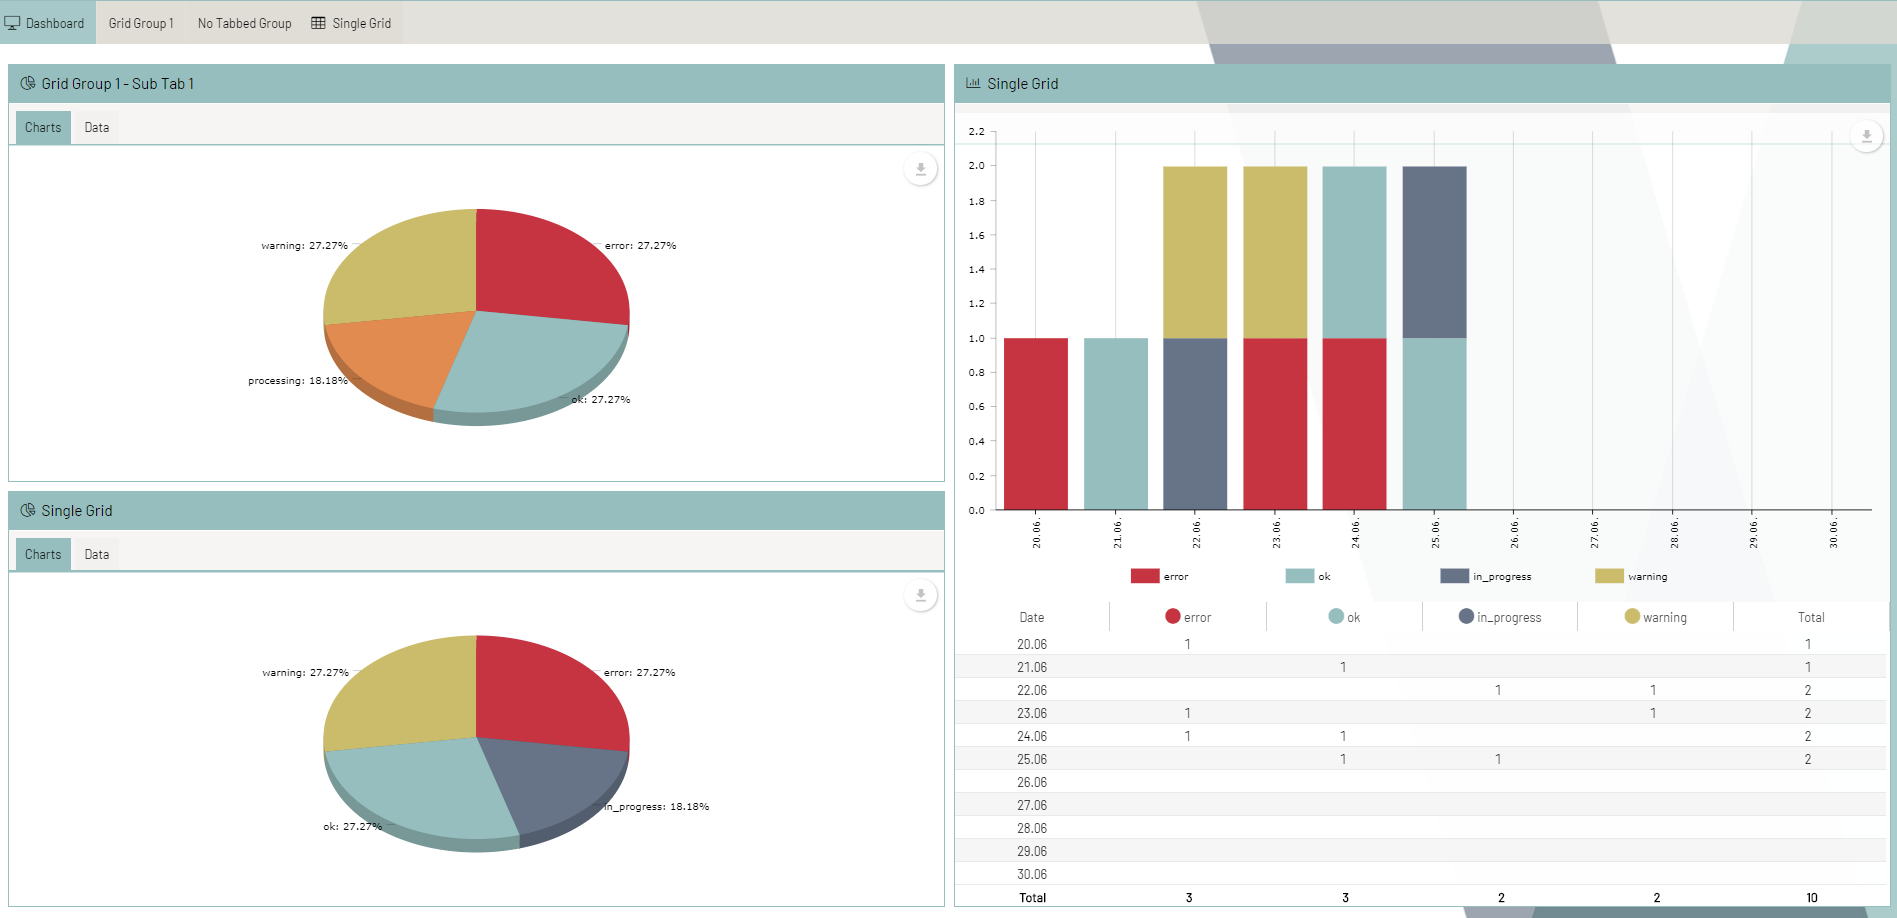
Dashboard Functions
Widgets are the basic building blocks of a dashboard. In the Process Monitor dashboard, you can add different widgets to perform different functions. The widgets provide the following functions:
-
Display information
If you place the mouse pointer over the "i", a preview of the information or content is displayed.
-
Jump to module
From the dashboard, the information displayed in the widget can be called up as a separate module via a functionality.
-
Move widget
To position the displayed widgets on the dashboard, each widget has a corresponding function icon.
-
Update widget
For refreshing the widget. Content, the user can request the Refresh. button of each widget.
-
Configure widget
To make detailed configurations for a widget in its dashboard view, a corresponding configuration function can be applied directly from and in the dashboard widget view. You can change some settings in dashboards, such as the display duration of status entries or the title of the dashboard: See Adjusting the Dashboard.
-
Remove widget
To remove a widget from a dashboard view, the corresponding function icon from a widget must be activated.
Using Multilingualism in the Process Monitor
You can use the INUBIT Process Monitor in multiple languages and switch to any language supported by the BPC Portal and for which corresponding properties files have been created.
Changing the Language Setting in the Portal
The default language setting in the Process Monitor in the portal is German. German and English (US and GB) are supported by default.
Proceed as follows
To switch between German and English, choose one of the following methods:
-
Change the language when you log in:
-
Click the dropdown-menue and choose the language in the portal login dialog. The login dialog language changes accordingly.
-
Log in with your user data. The Process Monitor is displayed in the selected language.
-
-
Change language within the Process Monitor:
-
Click the name of the logged-in user. The control area opens.
-
Choose User Data > Change Language.
-
Select the desired language.
-
Return to the Process Monitor by clicking Back to INUBIT Cockpit. The interface is displayed in the selected language.
-
|
If your chosen language is not available after clicking the corresponding country flag (no suitable |