Validating and Testing Diagrams
Usage
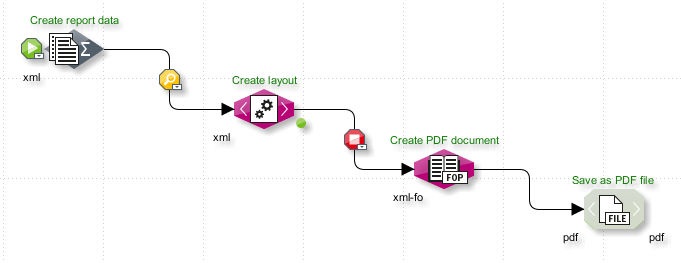
The INUBIT software features an integrated test environment that allows you to check that executable diagrams (Technical Workflows) function correctly before putting them into production.
The integrated test environment offers the following functions:
-
Test mode
For starting and executing workflows manually. You can use the test mode locally and on the INUBIT Process Engine.-
Locally
For the execution the local workflow and module settings are used. -
On the INUBIT Process Engine
The workflow and module settings are used which are stored on the server.
Workflows can be tested in their entirety or partially.
Refer to Test Mode: Testing Diagrams.
-
-
Watch mode
In watch mode you can monitor the execution of event- or time- controlled diagrams on the INUBIT Process Engine. Event- or time- controlled diagrams are diagrams which are started by a scheduler or through a system connector configured as listener.
Refer to Using the Watch Mode. -
Test workflows
In addition, you can test Technical Workflows using specially created validation workflows to check their adherence to particular conditions. Refer to-
Defining a Test Workflow in section Configuring Miscellaneous
-
Defining a Notify Workflow in section Configuring Miscellaneous
-
Unit Tests
With the unit test component you can create test cases for Technical Workflows. These test cases check the diagrams section by section. Test parameters like input messages, variables and test conditions are stored at the test case in order that these tests can be repeated any time. Executing the test cases can be automatized, test results are recorded.
Refer to Using Unit Tests.
Further support for testing is offered by the following INUBIT functionalities:
Test Mode: Testing Diagrams
Prerequisites
The user role or the user has the right Test mode for the diagram to be tested.
Overview
Executable diagrams like Technical Workflows can be tested in the server mode as well as in the local mode.
During the test, a status marker moves from module to module to signalize the current state of message execution:
The different colors of the status markers have the following meanings:
-
Green: The module was processed successfully.
-
Red: The module was not processed successfully.
The test was stopped and an error message was issued. -
Blue: The system connector is executed again.
This occurs, for example, if establishing a connection is retried. -
Yellow: The module waits for a defined event, for example, for a point in time or for another module’s end of execution.
Testing diagrams entirely or partially
You can test diagrams in their entirety or partially by defining start and breakpoints:
-
 Start point
Denotes the module or connection at which a test starts. -
Break point
Points in the diagram at which the test is halted. You can either let the test always halt at the break point or define conditions for halting.
Refer to step Define conditions for break points below.
The stopped test run can be continued via the context menu of the breakpoint.
Displaying test results
During the test, watch points ( ) are additionally set on all connections.
When the workflow’s execution is finished or interrupted, you can display the test results and the current state of the message and variables processing at each watch, start, and break point.
) are additionally set on all connections.
When the workflow’s execution is finished or interrupted, you can display the test results and the current state of the message and variables processing at each watch, start, and break point.
Refer to Dialog Watch Point.
Test data
You can start tests e.g. with an initial sample test message that you receive from your business partner. After running the first test, you can save and reuse the test results that are displayed at watch, start, and break points. By doing this, you have the following option among others:
-
Save messages
You can save the messages in the file system or the Repository and use them for further tests.
-
Save messages and variables
You can save messages and variables together as a watchpoint file (
*.wpffile) and store them in the file system or Repository.
Specifics
In the test mode, the following specifics apply:
-
Event- or time-driven workflows
Workflows with system connectors configured as listeners and/or with activated schedulers are only executed if you start them manually. Alternatively, use the watch mode. -
Retry and wait mechanisms
Retries and waitings are not executed.
Proceed as follows
-
Display the Technical Workflow you wish to test.
-
Define the start point:
-
Select the connection at which you want the test to begin. If the test is to start at the first module in the workflow, select the first module.
-
Open the context menu then select Set start point.
-
-
Define break points:
-
Select a connection
-
Open the context menu and select Set break point.
-
-
Define conditions for break points:+ After having created a break point, you can define under which conditions the test should be halted at the break point:
-
Open the break point’s context menu and select Define break point conditions. A dialog opens.
Use this dialog to define one or more conditions. A condition consists of an XPath expression or of a value comparison. The values can come from elements in XML-based messages or variables or can be defined statically. For comparing the values, the following operators are available:Operator Meaning =
equal
<
less than
>
greater than
>=
greater than or equal
⇐
lesser than or equal
!=
not equal
Exists
exists
NotExists
exists not
XPath
XPath expression
Examples:
-
/ORDER/ORDERSUM > 1000 -
/ORDER/DELIVERY/ = Express -
/IBISProfile/Profile/Name Exists -
count(/Order/test1) > 1This condition is met when the result of the XPath expression
count()is that the node/Order/test1exists more than once.The buttons have the following meaning:
-
D: The value comes from an element in an XML-based message, which should be compared with another element, a variable, or a static value. You enter the element’s path as XPath expression. The
 button opens a wizard for creating the XPath expression.
 -
V: The value comes from a variable, which should be compared with a data element, a variable, or a static value. All existing variables are displayed in the adjoining list.
-
X: The condition refers to an XPath expression. The XPath is executed on an empty document, not on messages. The
button opens a wizard for creating the XPath expression. -
S: The comparison value is a static value, which you enter manually.
-
-
To define further conditions, click Add condition. If there are at least two conditions, you can define the operator with which the conditions are to be linked:
-
AND: All conditions must be met.
-
OR: One of the conditions must be met.
-
-
Click OK to close the dialog.
-
-
Click the workspace then select one of the following commands in the context menu:
-
Load test file
Opens a file explorer and starts the test using the selected file from the file system. -
Start test without file
Select this command for modules that do not require a start file, such as, for example, the workflow starter or the report data collector. -
Start test with the clipboard content
This command allows you, for example, to start the test using the (intermediate) result file from the test of another Technical Workflow. To do this, the result file from the other workflow must have been previously copied to the clipboard. -
Start test with repository file
To start the test with a file stored in the Repository. Opens the Repository Explorer for selecting a file.→ The diagram test is started using the selected option. At the end of the test, a message is displayed confirming either successful completion or an error.
-
Resetting the test mode
To remove all status markers (start-, watch-, and breakpoints) after testing, open the context menu of the designer’s working area and select Reset test mode.
Displaying Test Results and Error Messages
You can display the current state of the message processing and the current values of variables at any of the watch points. If a test fails on a module you can display the error message for that module.
Proceed as follows
-
Test the workflow.
-
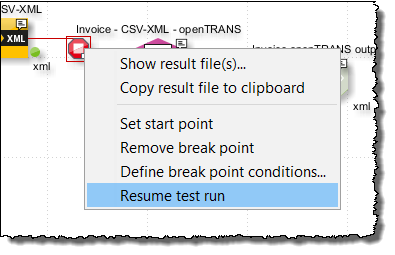
After completing the test, open the context menu of a start point, watch point or break point and select Show results file(s). Alternatively, double-click the test point.
You can copy the result file directly to the clipboard without opening it using the context menu entry Copy result file to clipboard.
→ The Dialog Watch Point opens and displays the current test results, the variables and their current values. In case of an error, an error message is displayed. If you want to display the error message again later, select the module on which the test failed, open the context menu, then select Show error message.
You can save the test results in order to reuse them in later tests.
Changing the Test Point Refresh Interval
Where the Technical Workflow is either very long and nested, or very short, it can be useful to adjust the time interval at which the display of the test points is refreshed so as to better match it to the rate at which the workflow proceeds.
Proceed as follows
-
Click the workspace of your Technical Workflow.
-
Open the context menu, then select Refresh test points > Very fast/Fast/Normal/Slow.
Using the Watch Mode
With the watch mode you monitor the execution of event or time driven workflows stored on the INUBIT Process Engine, that means workflows which are started by a scheduler or listener.
The state of the execution of a Technical Workflow is shown by means of colored symbols. During execution of the workflow, watch points are automatically set between the modules at which you can display the intermediate results.
Refer to Test Mode: Testing Diagrams.
|
Wait modules are not executed in the watch mode. |
Prerequisites
The diagram has already been published.
Activating the Watch Mode
Proceed as follows
-
Display the diagram that you want to monitor in watch mode.
-
Click the workspace, open the context menu, then select one of the following:
-
Activate watch mode
The execution of the process is displayed as long as the process is running or until the watch mode is deactivated. -
Activate watch mode for next process
The first run of the process is displayed, then the process is executed further without being displayed.
-
The current mode is displayed in the INUBIT Workbench status bar: Mode: Watch. After the first execution, the workflow’s process ID (PID) is also displayed in the status bar.
Refer to Dialog Watch Point.
Activating Conditional Watch Mode
Proceed as follows
-
Display the diagram for which you want to define a condition whose fulfillment will activate the watch mode.
-
Open the context menu of the module for which you want to define the condition.
-
Select the menu item Activate watch mode with condition. A dialog opens.
This option is only available if the watch mode is not activated for other modules or for the diagram as a whole. To deactivate the watch mode, click the work area, open the context menu, and select the command Deactivate watch mode.
-
Define one or more conditions. A condition is either an XPath expression or the matching of two values. The values can come from elements in XML-based messages or variables, or they can be defined statically. The following operators are available for matching values:
Operator Meaning =
Equal
<
Less than
>
Greater than
>=
Greater or equal
⇐
Less or equal
!=
Not equal
Exists
Exists
NotExists
Does not exist
XPath
XPath expression
Examples:
-
/ORDER/ORDERTOTAL> 1000 -
/ORDER/DELIVERY/ = Express -
/IBISProfile/Profile/NameExists -
count(/Order/test1)> 1
The condition is fulfilled if the result of the evaluation of the XPath functioncount()is that the node/Order/test1exists more than once.
The buttons have the following meanings: -
D: The value comes from an element in the XML-based message that is to be compared with another element, a variable or a static value. You specify the path to the element as an XPath expression. The
button opens an assistant for creating the XPath expression. -
V: The value comes from a variable that is to be compared with another data element, a variable or a static value. The existing variables are displayed in the adjacent list.
-
X: The condition refers to an XPath expression. The XPath is executed on an empty document, not on messages. The
button opens an assistant for creating the XPath expression. -
S: The comparison value is a static value that you enter manually.
-
-
To define more conditions, click Add condition. When there are at least two conditions, you can define which operators the conditions are to be linked with:
-
AND: All conditions must apply.
-
OR: One of the conditions must apply.
-
-
Click OK to close the dialog.
→ In the INUBIT Workbench status bar, the current mode is displayed: Mode: Watch. After it is executed for the first time, the process ID (PID) of the workflow is also displayed in the status line.
Refer to Dialog Watch Point.
Deactivating the Watch Mode
Proceed as follows
Click the workspace, open the context menu then select Deactivate watch mode.
|
A workflow’s watch mode is automatically deactivated if you display a Technical Workflow that is in a different mode. In this case you must re-activate watch mode when you return to the workflow you were originally monitoring. |
Validating Diagrams against a Validation Workflow
Usage
You can let diagrams validate against a so called test workflow. As soon as a validation workflow is defined, the validation is generally executed when deploying diagrams. Additionally, you can also trigger the validation manually on demand.
Principle Approach: Validating Against a Validation Workflow
-
Creating a Technical Workflow
You create the Technical Workflow which is to be used for the validation:
The Technical Workflow always receives the names of the diagrams which are to be validated as input message. When deploying the input message contains the names of the diagrams to be deployed, when validating manually it contains the names of the manually selected diagrams. Furthermore, the name of the user or the user group is passed to the Validation Workflow.
Using these names you can request further information about the diagrams to be validated by using, for example, the utility INUBIT IS Configuration. Then, using other modules you can let the result of this request analyze according to your needs.
The validation result is displayed as a message in the INUBIT Workbench. Using the appropriate modules in the Technical Workflow, you can also let the result write into the file system or mail it. -
Defining a Technical Workflow as Validation Workflow
You define finished Technical Workflow as so called validation workflow on the INUBIT Process Engine. Once defined the validation workflow is available to all users of an INUBIT Process Engine. -
Validating against a validation workflow
-
Automatically when deploying
As soon as a validation workflow is defined, it is invoked automatically on deployment. The deployment is always completed, even if the validation fails. -
Manually on demand
You can start the validation manually in the Designer anytime.
-
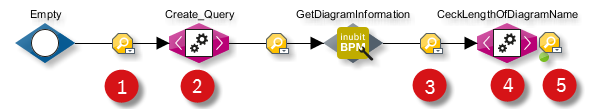
Sample Validation Workflow: Guaranteeing a Fixed Length of Module Names in Diagrams
The following validation workflow checks if the module names in diagrams are longer than ten characters. If the module names are shorter the validation workflow outputs an error message.
-
As input message each validation workflow always receives the names of the diagrams to be validated, for example:
<Validate> <Diagram>Invoice Supplier A</Diagram> <Diagram>Order</Diagram> </Validate> -
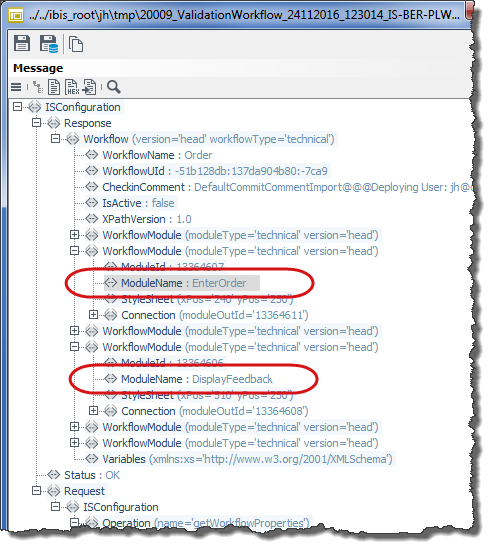
To be able to check the length of module names the names of the modules in the diagrams must be known. For reading out such detail information the utility INUBIT IS Configuration offers the function
Get_Workflow_Properties_Type. The XSLT Converter created the required function call and forwards it as input message to the utility INUBIT IS Configuration: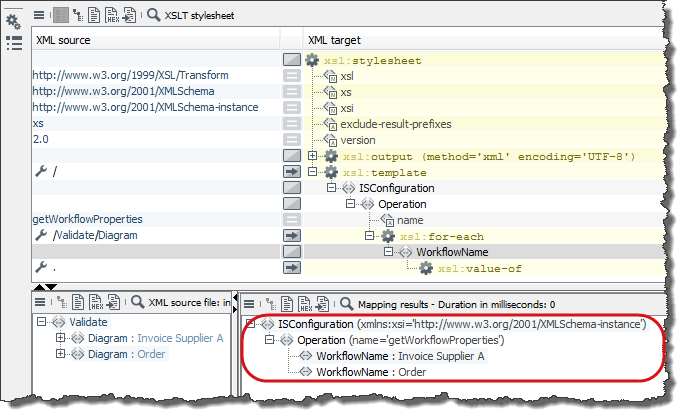
-
The utility INUBIT IS Configuration executes the function which is defined in the input message and outputs the properties of the diagrams. The module names are amongst these properties:
-
The XSLT Converter receives the message containing the properties, extracts the module names and checks their length:
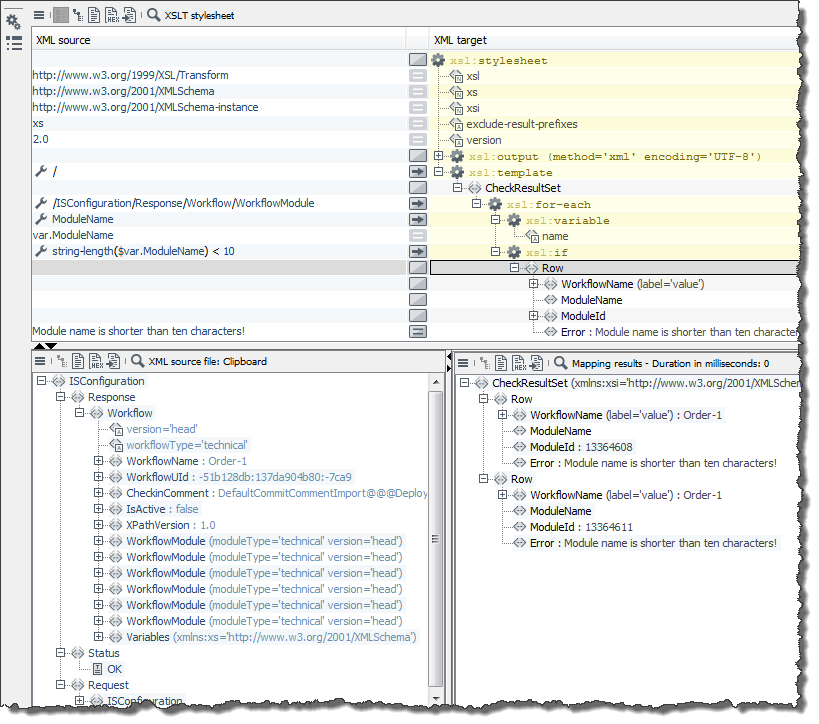
If the modul name is shorter than ten characters, the XSLT Converter creates an error message. The error message contains all modul names which did not meet the validation conditions.
-
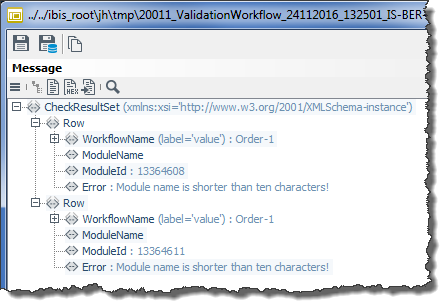
The error message is output as result of the validation if modules do not meet the validation conditions:
Defining a Validation Workflow
Prerequisites
The Technical Workflow which is to be used as validation workflow already exists.
Proceed as follows
-
In the INUBIT Workbench, open the Administration > General Settings tab.
-
Display the Administration > Diagrams configuration area.
-
In the Validation workflow row click
to select a Technical Workflow.
A wizard opens up. -
Let the wizard guide you through the configuration of the validation workflow. After finishing the wizard the name of the selected validation workflow and the start module are displayed in the row.
-
Save the information by clicking
 .
.
Deleting a Validation Workflow
Proceed as follows
-
In the INUBIT Workbench, open the Administration > General Settings tab.
-
Display the Administration > Diagrams configuration area.
-
In the Validation workflow row click
 and confirm the confirmation dialog.
→ The connection to the Technical Workflow is deleted, in the Validation workflow row neither the workflow name nor the module name are displayed anymore.
Validating Diagrams Manually Against a Validation Workflow
You can validate single diagrams or a group of diagrams.
Prerequisites
-
The diagrams must already have been published!
-
The validation workflow is defined.
Proceed as follows
-
Select the diagram or the diagram group in the directory tree.
-
From the context menu select Start validation workflow.
→ The diagram is validated using the specified validation workflow. After the validation the result is displayed.
Using Unit Tests
|
This feature must be activated in your license in order for you to use it. To extend your license, please contact the support of the Virtimo AG. |
Usage
With the unit test component of the INUBIT software you can verify if the conditions defined at breakpoints in Technical Workflows are fulfilled.
To do this, you create one or more test cases for the workflow that are to be checked. Each test case checks a particular unit of the workflow. Of course, you can also test individual modules. Test parameters are stored directly in the test case so that the tests can be repeated at any time. Test parameters are, for example, input messages and variables for starting the test case and conditions that the test result is checked against.
You can start single test cases and groups of test cases manually or automatically. Test results are recorded in a protocol that displays all conditions for each breakpoint that are not fulfilled.
|
Values of variables for a Technical Workflow can be changed in a unit test by editing the start point of the unit test. Constant values of any global variable cannot be changed for a unit test. |
|
Technical Workflows connected by Workflow Connectors: Testing graphical user interfaces and concurrency |
|
Preferably, start unit tests in your development and test environment so that your productive environment is not affected. |
Creating Test Cases
You create a test case directly at the Technical Workflow which is to be checked.
For defining the units to be checked you use start and break points which are stored in the test case. At the start point you define the start data, at the break points you define the test conditions the test result are checked against.
When you publish the Technical Workflow, the test case including the start data and the test conditions are automatically stored into the Repository as XML file.
Prerequisites
-
The Technical Workflow is already defined.
-
The data required for starting the test case are stored in the Repository or in the clipboard.
-
The data required for defining test conditions are stored in the Repository, in the file system or clipboard.
Proceed as follows
-
Open the Technical Workflow for editing.
-
From the sidebar, open the Unit tests docking window.
Creating an empty test case
-
In the toolbar, click on
 .
The dialog for creating a test case opens.
.
The dialog for creating a test case opens. -
Name the test case and enter a short description.
The description of the test case is displayed in the Repository view Unit test files after the workflow has been published. -
Click OK to close the dialog.
Defining start and break points
-
Add a start point and one or more break points to your diagram.
-
Open the context menu of the test case and select Take over test points from diagram.
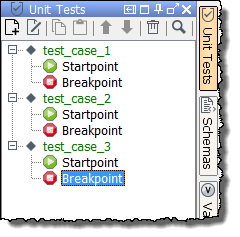
The start point and all break points in the diagram are taken into the test case and are displayed:Defining start data
-
Double-click the start point. The dialog for selecting the start file opens.
-
Load the start file from the Repository or from the clipboard.
If you inserted the start file from the clipboard, you can store it manually into the Repository using the
button.
Otherwise, the start file is stored into the Repository automatically when you publish the diagram. -
Click OK to close the dialog.
Defining test conditions
-
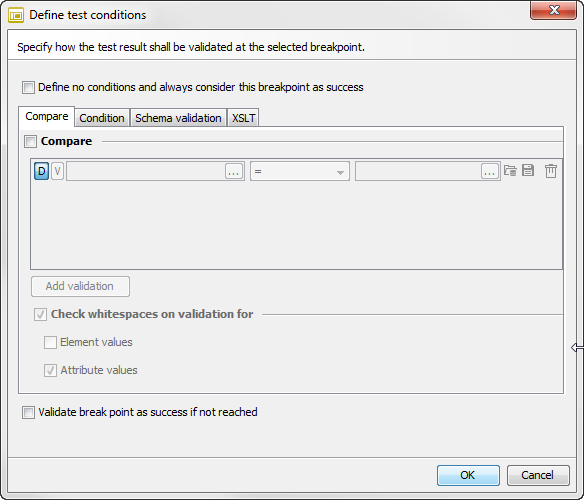
In order to define the conditions the message at a break point should be checked against double-click the breakpoint in the test case. The dialog for defining conditions opens up.
Specify how the test result is to be checked.
Refer to Dialog Defining Test Conditions for Unit Tests. -
Close the dialog with OK.
-
Publish the diagram so that the test case including the start data and test conditions is stored in the Repository.
Alternatively, you can create a test case directly after a local test run. If you let the option Take over test points from diagram checked, the start point, all break points and the start data are taken over automatically into the test case.
Executing Test Cases
You can let execute a single test case or multiple test cases belonging to the same workflow. If you let execute multiple test cases these are executed in the order they are displayed in the docking.
Refer to Moving Test Cases.
The results are signaled in the docking window directly at the test case. Additionally, you can display a detailed report about the test result at each break point.
Prerequisites
The workflow is published.
Proceed as follows
-
Display the Technical Workflow whose test cases you want to execute.
-
From the sidebar open the docking window Unit Tests.
-
Select one or more test cases, open the context menu and select Start test case or Start test cases.
→ The selected test cases are executed. Similar to the test mode watch points and test points display the progress made in executing.
After the test the result is visualized in the docking window directly at break point at the test case, for example:
-
Red marker: The test has failed.
-
Green marker: The test was successful.
-
Displaying test result
Proceed as follows
-
Select the break point whose result you wish to display.
-
Open the context menu and select Show validation result.
Editing Test Cases
At any time you can add new break points to your test case, delete break points or move the start point by adding it at another position.
If you display and change the test points of a test case in the diagram, for example by deleting a break point, then the corresponding break point in the test case is highlighted in red. This signals that the test points defined in the test case are not identical anymore with the test points visible in the diagram.
In this case you can use the following functions via the test case’s context menu:
-
Take over test points from the diagram adapts the test case to the currently displayed test points
-
Set test points in diagram adapts the test points in the diagram to the test case
Adding test points
Proceed as follows
-
Open the diagram belonging to the test case for editing.
-
From the sidebar open the Unit Tests docking window.
-
Click on the test case. The test points are displayed in the diagram.
-
Add a new start point or some break points to the diagram.
-
Select the test case in the docking window again, open the context menu and select Take over test points from diagram. The new test points are displayed beneath the test case.
-
Publish the diagram.
Deleting test points
Proceed as follows
-
Open the diagram belonging to the test case for editing.
-
From the sidebar open the Unit Tests docking window.
-
Expand the test case.
-
Select the break point that you want to delete, open the context menu and select Delete.
-
Confirm the prompt.
→ The test point is deleted.
Moving Test Cases
You can move test cases within a diagram by Drag’n’Drop and thus change the order of the test cases in the Unit Tests docking window as you like.
The order of the test cases is important when executing them: If you start multiple test cases of a diagram simultaneously, the test cases are executed in the order they are displayed in the docking window.
Exporting Test Cases
For exporting test cases use one of the following options:
-
Export the diagram, diagram group or all diagrams of the user including the test cases. Make sure the option Export unit tests is selected.
-
Export the test cases without the respective diagrams from the Repository.
-
Export the user group the diagrams containing the test cases belong to. Make sure the option Export Repository files is selected.
Refer to
Managing Test Cases in Test Suites
Overview
In order to re-use test cases order or to automatize their execution you can create a so called test suite and add your test cases to it.
Besides test cases a test suite can also contain further test suites.
Creating a Test Suite in the Repository with Test Cases from Multiple Diagrams
Prerequisites
-
The test cases already exist.
-
The Technical Workflows the test cases belong to are already published.
Proceed as follows
-
In the INUBIT Workbench, display the Repository tab.
-
Select the Unit test files view.
Refer to Repository User Interface. -
Open the folder where the test suite should be stored.
-
Do one of the following:
-
In the toolbar of the directory area click
. -
Open the context menu of the area and select Create test suite.
-
Press the Insert key.
The dialog for creating a test suite is displayed.
-
-
Name the test suite, enter a description and the persons in charge.
-
To add a test case or another test suite, do one of the following:
-
Click
. -
Open the context menu of the table and select Add test suite.
The Repository Explorer opens.
-
-
Navigate to the test case or to the test suite which you want to add, select it and close the dialog with OK.
The selected file is displayed in the table. -
The test cases of a test suite are executed in the order in which they are displayed in the table. You can use arrow buttons to sort the test cases.
-
Close the dialog with OK. Another dialog opens.
-
Optionally you can enter a versioning comment.
-
Close the dialog with OK.
→ The new test suite is displayed in the Directory area.
Creating a Test Suite in the Repository with Test Cases from a Single Diagram
Prerequisites
-
The test cases already exist.
-
The Technical Workflows the test cases belong to are already published.
Proceed as follows
-
In the INUBIT Workbench, display the Repository tab.
-
Select the Unit test files view.
Refer to Repository User Interface. -
Open the directory the test cases are stored in.
-
Select all test cases which you want to add to the test suite and select from the context menu Combine to test suite.
Do not select reports. If reports have been selected accidentally, the Combine to test suite command is deactivated. You must first remove the selection from the report in order to be able to create the test suite.
The dialog for creating a test suite opens. In the table all selected test cases are displayed.
-
Name the test suite, enter a description and a person in charge.
-
To add another test case or test suite do one of the following:
-
Click
. -
Open the context menu of the table and select Add test suite.
The Repository Explorer opens,
-
-
Navigate to the test case or test suite you want to add, select it and close the dialog with OK.
The selected file is displayed in the table. -
Use the arrow buttons to display the order in which the test cases should be executed.
Test cases are executed in the order they are displayed in the table. -
Close the dialog with OK. Another dialog opens.
-
Optionally you can enter a versioning comment.
-
Close the dialog with OK.
→ The new test suite is stored in the same directory as the test cases.
Creating a Test Suite with All Test Cases of a Diagram
You can combine all test cases that belong to a Technical Workflow to a test suite in the Designer.
Prerequisites
-
The test cases already exist.
-
The Technical Workflows the test cases belong to is already published.
Proceed as follows
-
Display the diagram whose test cases you want to combine to a test suite in server mode.
-
Select the diagram and choose Create test suite in the context menu.
The dialog for creating a test suite opens and automatically contains all test cases belonging to the diagram. -
Accept the suggested name for the test suite or enter a new one.
-
Enter a description and the persons responsible.
-
Use the arrow buttons to display the order in which the test cases should be executed.
Test cases are executed in the order they are displayed in the table. -
Choose OK to close the dialog.
-
Enter a comment for the new version of the file to be created in the Repository.
-
Click OK.
→ The new test suite is stored in the Repository.
Creating a Test Suite with All Test Cases of a Diagram Group
You can combine all test cases that belong to the diagrams of a diagram group to a test suite in the Designer at once.
Prerequisites
-
The test cases already exist.
-
The Technical Workflows the test cases belong to are already published.
Proceed as follows
-
Display the diagram group whose test cases you want to combine to a test suite in server mode.
-
Select the diagram group and choose Create test suite in the context menu.
The dialog for creating a test suite opens and automatically contains all test cases available in the diagram group. -
Accept the suggested name for the test suite or enter a new one.
-
Enter a description and the persons responsible.
-
Use the arrow buttons to display the order in which the test cases should be executed. Test cases are executed in the order they are displayed in the table.
-
Choose OK to close the dialog.
-
Enter a comment for the new version of the file to be created in the Repository.
-
Click OK.
→ The new test suite is stored in the Repository.
Starting a Test Suite Manually
Proceed as follows
-
In the INUBIT Workbench, display the Repository tab.
-
Select the Unit test files view. Refer to Repository User Interface.
-
Open the folder in which the test suite is stored.
-
Select the test suite, open the context menu and select Execute test suite.
→ The test suite is started. After all test cases were executed, a report with all test results is created and displayed. After closing the report the report is stored automatically in the same directory like the test suite.
Displaying the Result of a Test Suite’s Execution
Prerequisites
The test suite was already executed.
Proceed as follows
-
In the INUBIT Workbench display the Repository tab.
-
Display the Unit test files view. Refer to Repository User Interface.
-
Open the folder in which the test suite is stored.
-
Select the report.
-
In the details area display the Details tab.
→ A detailed tree view shows the result of the test suite’s last execution.
This report does not contain notes about errors that occured during workflow execution.
Exporting Test Suites
For exporting test suites use the following options:
-
Export a test suite without the associated diagrams from the Repository
-
Export the user group owning the diagrams the test suites refer incl. the Repository files
Refer to
Automatizing Unit Tests and Test Suites
For starting a test case or test suite controlled by time, you create a Technical Workflow containing a Workflow Starter and call up the test case or test suite using the INUBIT IS Configuration utility.
|
For starting multiple test cases or test suites, you have to create several operations in the XSLT Converter. |
Proceed as follows
-
Create a Technical Workflow.
-
Insert a Workflow Starter for starting the Technical Workflow at defined time intervals.
-
Add an XSLT Converter.
-
With the XSLT Converter, create an input message for the INUBIT IS Configuration utility in which the
Execute_Unit_Test_Typeoperation is called.
Refer to Creating Input Message for Calling-up Operations. -
In the operation call specify either the UID or the access path of the unit test. Proceed as follows:
-
In the Repository tab select the Unit test file view.
-
Navigate to the unit test which you want to execute.
-
Select the unit test and display the Details tab.
-
Copy the UID or the unit test’s access path to the clipboard by clicking on .
-
-
Into the Technical Workflow, insert an INUBIT IS Configuration utility.
-
Connect both modules.
→ The result will look like this: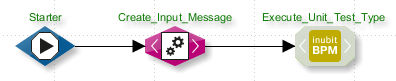
The INUBIT IS Configuration utility returns the test results as XML reports. Now you can, for example, convert this report to HTML and send it via e-mail by using further modules.
Dialog Descriptions for Unit Tests
Unit Tests Toolbar
-
: Create test case
Creates a new test case. -
 : Edit
Opens a dialog for editing a selected test case.-
Name: Name of the test case
-
Description: Descriptive comment
-
-
 : Copy
Saves a copy of the selected test case to the clipboard. -
 : Paste
Inserts the test case into the tree structure. The test case must have been loaded to the clipboard by cutting or copying first. -
 : Move up
Moves the selected test case up. -
 : Move down
Moves the selected test case down. -
: Delete
Deletes the selected test case. -
 : Search
Opens an input field for entering a search string.
Dialog Defining Test Conditions for Unit Tests
In this dialog you have the following options:
-
Define no conditions and always consider this break point as success
When activated, all further options in the dialog are deactivated. The break point is always validated as success whether the break point was reached or not.
Compare
Compares the content of a message or variable to a repository file. This validation is selected by default when a new test case is created and data exist at the break point.
-
Add validation (button)
Displays further control fields for defining validation rules. -
Operator for connection: For linking several conditions.
-
AND: All conditions must apply.
-
OR: One of the conditions must apply.
-
-
D (button):
The condition refers to the structure of the XML based message which reaches the breakpoint when testing, or it refers to values in this message.
You can enter an XPath expression into the input field. If an XPath expression is given, the validation is performed on the given subset.
No entry and the entry of/(slash) are identical and select the complete data set. -
V (button)
The condition refers to a variable. All available variables are displayed in the drop-down menu next to it. -
Operator
For selecting an operator for the comparison. The following operators exist:Operator Meaning =
Equal
!=
Unequal
-
Input field and
button (Choose file from Repository)
For choosing a file from the Repository to which the given XML structure or the value of the selected variable is to be compared. If you want to compare a variable value you must select a watchpoint file.
After executing the test in the input field a reference to the test file contained in the break point is displayed. -
 button (Show content) Opens a dialog and displays the file which is referenced in the input field next to the button.
 -
 button (Save to Repository…) Saves the file which is referenced in the input field into the Repository.
If you do not save the data manually, it is stored automatically to the Repository when you publish the diagram with the test case.
button (Save to Repository…) Saves the file which is referenced in the input field into the Repository.
If you do not save the data manually, it is stored automatically to the Repository when you publish the diagram with the test case. -
button (Delete) Removes the condition.
Conditions
For validating the result against one or more conditions.
If the validation was terminated without errors, an OK is written into the result report; if errors occurred, the report contains the failed conditions.
For testing non-XML data you can define regular expressions in the XPath expression.
Refer to Regular Expressions.
-
Add condition (button)
Shows the following control fields for defining conditions: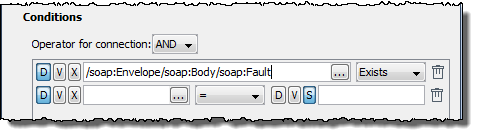
-
Operator: For connecting two or more conditions.
-
AND: All conditions must apply.
-
OR: One of the conditions must apply.
-
Button D: The condition applies to an element in the XML based data stream. In the input field, an XPath expression to must be entered.
If there is a sample XML file, click on the button and select the element interactively. -
Button V: The condition applies to a system variable. The list offers all system variables.
-
Button X: The condition applies to n XPath expression The XPath is processed on an empty document, not on the data stream. The
button opens a wizard for creating the XPath expression. -
Operator selection box
Selects an operator for a value comparison. The following operators can be selected:Operator Meaning =
equal to
<
less than
>
greater than
>=
greater than or equal to
⇐
less than or equal to
!=
not equal to
Exists
exists
NotExists
does not exist
XPath
XPath expression
-
Buttons D and V: See above
-
Button S: The condition applies to a string.
Example: -
/ORDER/ORDERTOTAL > 1000 -
/ORDER/DELIVERY/ = Express -
/IBISProfile/Profile/Name Exists
If the Name node exists in the incoming message, then the process branches to this connection. -
count(/Order/test1) > 1
If the XPath function’s count analysis shows that the` /Order/test1` node exists more than once, then the process branches to this connection.
Schema validation
For validating the content of an XML message or XML variable against an XML schema file. For validation, a schema file stored in the Repository is selected.
Refer to Schema check.
-
Add validation (button)
Displays further control fields for defining validation rules.-
Operator for connection: For linking several conditions.
-
AND: All conditions must apply.
-
OR: One of the conditions must apply.
-
-
D (button): See above.
-
V (button): See above.
-
Condition
For selecting a condition for the schema test. The following conditions exist:Condition Meaning validTo
Corresponds to the schema file
notValidTo
Does not correspond to the schema file
-
Choose file from Repository
For choosing a file from the Repository to which the break point data from the test case is supposed to be compared. In an initial test case, this can also contain local data from the break point. You can use the button to explicitly save it to the Repository. Otherwise, the data is automatically saved to the Repository during publishing.
-
XSLT
Validates the test result using an XSLT stylesheet.
You can define any mapping of your choice; the result is copied completely to the result report.
If the test result is to be visualized in the test case, you have to ensure that your mapping generates a success or error
element (depending on the result) at the root level or the first level underneath root.
-
Add validation (button)
Displays further control fields for defining validation rules.
-
Operator for connection: For linking several conditions.
-
AND: All conditions must apply.
-
OR: One of the conditions must apply.
-
-
D (button): See above.
-
V (button): See above.
-
XSLT script
For selecting and editing an XSLT stylesheet and for validating the test result.For simplifying the validation you can use the assert functions derived from JUnit tests. For more information, display the template by clicking on Edit.
-
Validate break point as success if not reached
By default this option is not selected in order to ensure that the validation is rated as incorrect if the breakpoint data is missing.-
Option not selected:
If a break point is not reached when processing the workflow, the test case fails at the corresponding break point. An error is thrown. -
Option selected:
The test is rated as correct, even if break points weren’t reached.
-
Dialog Watch Point
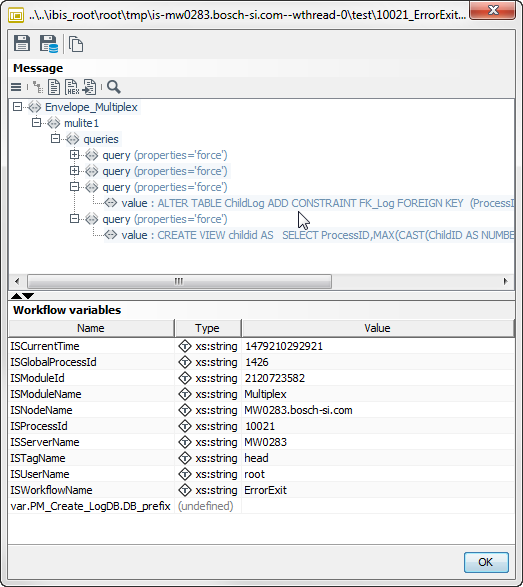
The watch point dialog consists of the following areas:
-
Toolbar
-
Save watchpoint file…
Saves the message to the file system.
-
 Save watchpoint file to Repository
Generates a
*.wpffile and saves it to the Repository. Refer to Test Mode: Testing Diagrams. -
Copy to clipboard
Saves the message including all workflow variables to the clipboard. You can use this function, e.g. to create variables in the XSLT Converter or start a workflow.
-
-
Messages
The messages are displayed according to their format. By default, XML files are displayed as a tree structure.
-
Variables
List of all workflow variables with their current values.