Adjusting the Process Monitor Grid
The following sections explain how to configure Process Monitor grids for evaluation and adjust them to your requirements.
You configure the Process Monitor grids in the XSLT variable of the BPC_Assign_hook module in the BPC_299_PM_Configuration workflow.
Proceed as follows
-
Open the technical workflow
BPC_299_PM_Configurationfor editing. -
Open the variables mapping of the
BPC_Assign_hookmodule. -
Select the
XSLTSource variable. -
In the Source section, click the Edit button next to the Style sheet label to open the XSLT editor.
-
Adjust the element(s) described in the following sections
-
Save the changes and publish the
BPC_299_PM_Configurationworkflow.
Adjusting the Number and Display of Grids
In the default configuration, the included workflows generate five Process Monitor grids distributed among one single grid and two grid groups:
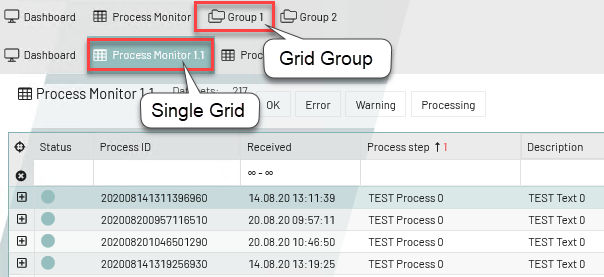
Multiple grids can be combined to form a grid group. A grid group can consist of multiple (single) grids and you can decide for each grid group whether the grids should be displayed cascaded or on tabs:
-
Single grid
Contains a single Process Monitor grid and a corresponding dashboard.
-
Grid group 1
In the default configuration, contains two Process Monitor grids (single grids) each displayed on their own tab (sub tab 1 and sub tab 2). For the entire grid group, there is a group dashboard as well as a separate dashboard for each grid on its tab.
-
No tabbed Group
Also contains two Process Monitor grids, but cascaded rather than on separate tabs.
You can adjust the number and display of grids individually: You can display multiple single grids as well as multiple groups of grids.
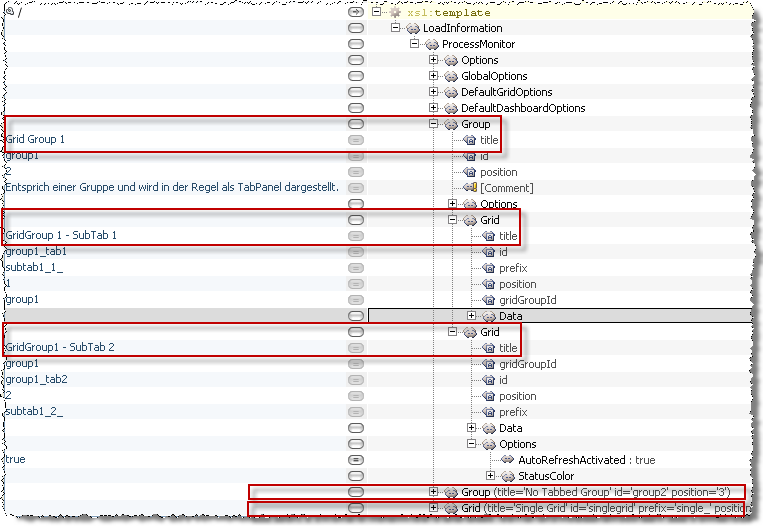
Each Process Monitor grid is represented by a Grid element and every grid group is represented by a Group element in the XSLT variable of the BPC_Assign_hook module in the BPC_299_PM_Configuration workflow.
The grouping of grids is represented by nesting the grid elements in the group element:
Displaying Single Grids
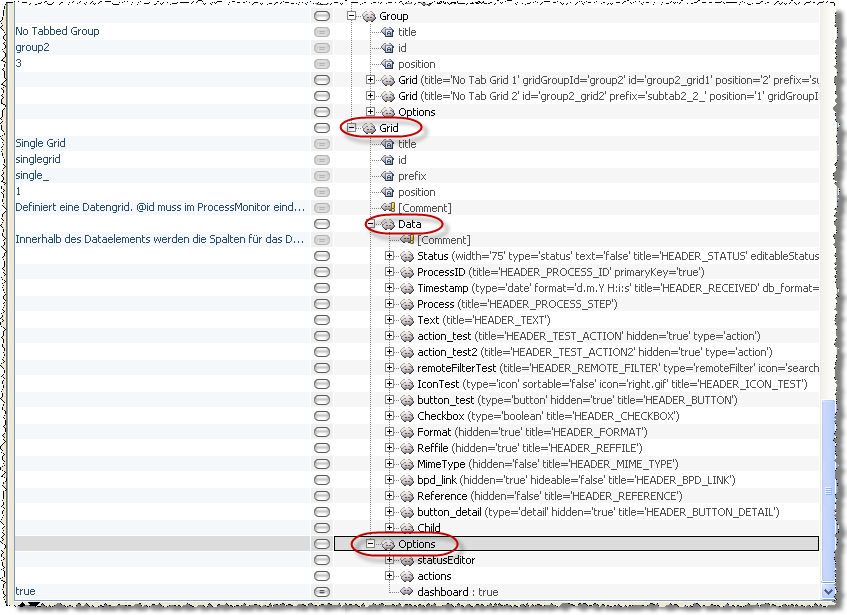
Single grids are each represented by a Grid element in the XSLT variable of the BPC_Assign_hook module in the
BPC_299_PM_Configuration workflow:
Prerequisites
The database schema exists, but no tables have been generated yet.
Proceed as follows
-
If you want to display multiple single grids, insert multiple
Gridelements into the XSLT variable of theBPC_Assign_hookmodule in theBPC_299_PM_Configurationworkflow like in the above excerpt from the XML configuration:-
Open the technical workflow
BPC_299_PM_Configurationfor editing. -
Open the variables mapping of the
BPC_Assign_hookmodule. -
Select the
XSLTSource variable. -
In the Source section, click the Edit button next to the Style sheet label to open the XSLT editor.
-
Under
LoadInformation/ProcessMonitor/DefaultGridOptions, set the value of elementtabbingto`false`.
-
-
Click OK to save the changes.
-
Publish the workflow.
-
Create a new database table:
Refer to Creating Database Tables
-
Log on to the portal again to display the changes.
Combining Single Grids to Form Grid Groups
You can combine multiple groups to form grid groups and decide for each group whether the grids should be displayed next to each other on tabs or cascaded.
Prerequisites
The database schema exists, but no tables have been generated yet.
Proceed as follows
-
In the XSLT variable of the
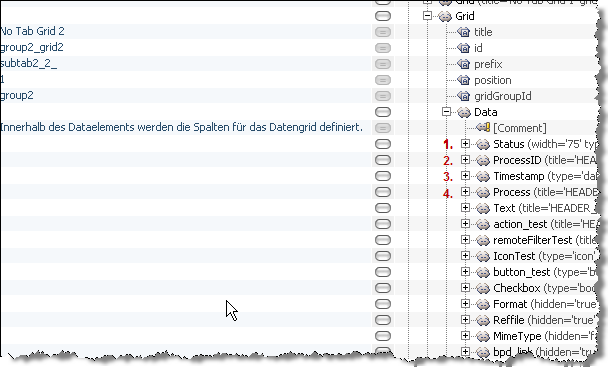
BPC_Assign_hookmodule in theBPC_299_PM_Configurationworkflow, insert aGroupelement. -
Copy one or more
Gridelements with all sub-elements and insert them into theGroupelement. Alternatively, you can also create newGridelements in theGroupelement. The XML structure for a grid group looks like this, for example: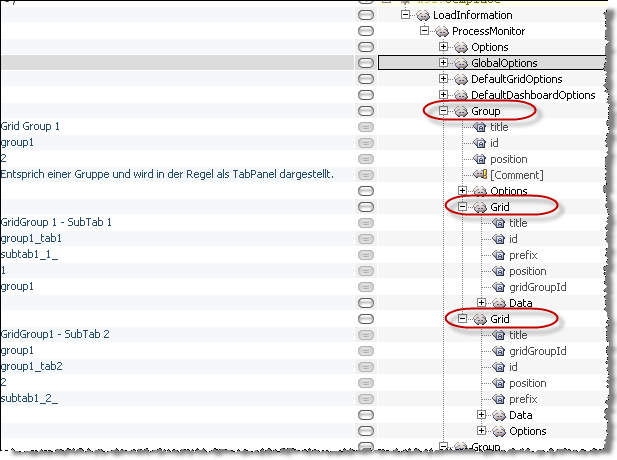
-
Ensure that the attribute
gridGroupIdof all sub-elements in a group (grid or group) corresponds to theidattribute of theGroupelement according to the following pattern:Group(id=abc) + Grid(gridGroupId=abc) + Grid(gridGroupId=abc) + Group(id=xyz; gridGroupId=abc) + Grid(gridGroupId=xyz) + Grid(gridGroupId=xyz)All
idattributes ofGridandGroupelements in the entire XSLT variable must be unique. ThegridGroupIdattributes, by contrast, must be present multiple times. -
Define whether the grids in a grid group are displayed on tabs or cascaded:
-
Group with tabbing:
Check whether in
LoadInformation/ProcessMonitor/DefaultGridOptionsthe value of elementtabbingis set totrueas in the default configuration. -
Group without tabbing:
Under
LoadInformation/ProcessMonitor/Group/Optionsinsert atabbingelement and set its value tofalse.
-
-
Define a title for the grid group in the
titleattribute of theGroupelement and—if tabs were created—tab titles in thetitleattribute of theGridelement.You can combine grid groups even further by nesting them according to the pattern for grouping grids in the XML configuration.
-
Publish the module.
-
Create a new database table:
Refer to Creating Database Tables
-
Log on to the portal again to display the change.
Adjusting the Height of Process Monitor Grids
You can set the height of the Process Monitor grid by defining the heightOffset as the minimum space between the grid and the bottom of the browser (in pixels).
The default value of heightOffset is 200.
Proceed as follows
-
Open the XSLT variable of the
BPC_Assign_hookmodule in theBPC_299_PM_Configurationworkflow for editing. -
Under
LoadInformation/ProcessMonitor/Optionsenter the minimum space to the bottom of the browser as value for theheightOffsetelement. -
Publish the workflow.
-
Log on to the portal again to display the change.
Adjusting the Height of Child Grids
You can set the height of a child grid in pixels by defining the heightChildGrid element.
The default value of
heightChildGrid is 150.
Proceed as follows
-
Open the XSLT variable of the
BPC_Assign_hookmodule in theBPC_299_PM_Configurationworkflow for editing. -
Under
LoadInformation/ProcessMonitor/Grid/Options, enter the required child grid height as value for theheightOffsetelement.You can use this setting for a grid within a group as well. To do this, navigate to the
heightChildGridelement within the options of the respective grid in the group:LoadInformation/ProcessMonitor/Group/Grid/Options/heightChildGrid. -
Publish the workflow.
-
Log on to the portal again to display the change.
Adjusting the Initial Sorting of Log Entries
You can specify how the log entries are supposed to be sorted initially.
In the default configuration, entries are sorted by their time stamps (LoadInformation/ProcessMonitor/DefaultGridOptions/
initialSortField:timestamp).
Proceed as follows
-
Open the XSLT variable of the
BPC_Assign_hookmodule in theBPC_299_PM_Configurationworkflow for editing. -
Under
LoadInformation/ProcessMonitor/DefaultGridOptionsenter the name of any XML element that generates a table column as the value for theinitialSortFieldelement, e.g.initialSortField:status. Parent log entries are then sorted according to this column in the grid. -
To define the sorting direction, enter either
ascordescas the value for theinitialSortDirectionelement.If you want to change the initial sort order of child entries, fill the properties
initialChildSortFieldandinitialChildSortDirectionwith the desired values like in steps 2 and 3. -
Publish the workflow.
-
Log off from the portal and then log on again to display the changes.
Controlling the Sorting of Columns
You can define whether the user shall be able to sort the log entries by columns in the Process Monitor grid.
To do this, use the sortable attribute for the relevant columns and set it to true (sortable) or to false (not sortable).
By default, some columns are sortable (e.g. Status) while others are not sortable (e.g. remoteFilterTest).
If you omit the attribute, the column is sortable.
Proceed as follows
-
Open the XSLT variable of the
BPC_Assign_hookmodule in theBPC_299_PM_Configurationworkflow for editing. -
Navigate to the column definitions of the related grid whose columns you want to configure:
LoadInformation/ProcessMonitor/Grid/DataorLoadInformation/ProcessMonitor/Group/Grid/Data. -
To control the sorting for a column, define the
sortableattribute for the related element and set its value totrue(sortable) or tofalse(not sortable), e.g.LoadInformation/ProcessMonitor/Grid/Data/IconTest/sortable = false: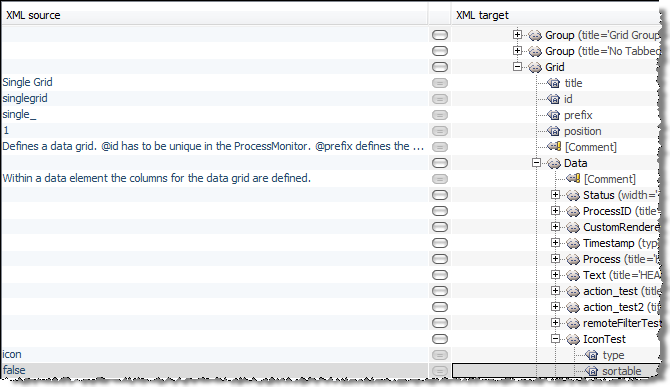
If you want the column to be sortable, you can omit the definition of the
sortableattribute. -
Publish the workflow.
-
Log off from the portal and then log on again to display the changes.
Defining the Column Order in the Process Monitor Grid
The order of the columns in the Process Monitor grid is defined by the order of the corresponding XML elements in the XSLT variable of the BPC_Assign_hook module in the BPC_299_PM_Configuration workflow below the corresponding Grid element in the Data element:
-
Order of XML elements in the stylesheet:
Users can use drag and drop to change the order of the columns in the detailed display.
Proceed as follows
-
Open the XSLT variable of the
BPC_Assign_hookmodule in theBPC_299_PM_Configurationworkflow for editing. -
Adjust the order of the elements below the
Gridelement in the `Data `element. -
Publish the workflow.
-
Log off from the portal and then log on again to display the changes.
Showing/Hiding Columns in the Process Monitor Grid
The following applies to the visibility of database columns in the form of grid columns: By default, all database columns configured with XML elements are available as columns in the Process Monitor grid.
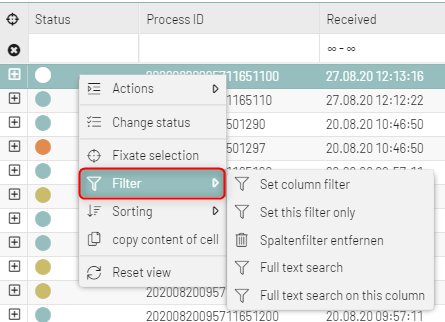
In the grid, the columns can then be shown or hidden through checkbox activation:
Refer to Grid Functions
Through the XML configuration, you can show or hide specific columns in a Process Monitor grid (attribute hidden) and make columns available or unavailable in the selection list for columns in the grid (attribute hideable).
Proceed as follows
-
Open the XSLT variable of the
BPC_Assign_hookmodule in theBPC_299_PM_Configurationworkflow for editing. -
Add attribute
hidden=trueto the column that you want to be hidden in the grid, for example: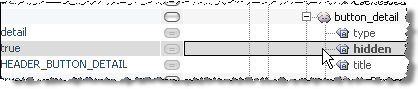
The corresponding column is not displayed in the Process Monitor grid. It can always be reactivated through the column selection list in the context menu of the grid columns
-
To deactivate display of the column in the column selection list in the grid, add the attribute
hideable=falseto the element, e.g.:If you set attribute` hidden=false` in combination with attribute
hideable=false, you generate a column that is visible and cannot be hidden even through the column selection list. -
Publish the workflow.
-
Log off from the portal and then log on to display the changes.
Changing the Names of Columns in the Process Monitor Grid
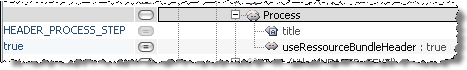
Column names are defined in the title attribute.
In the default configuration, the value is defined with a key and its key value from the properties file of the desired language; the value of the useRessourceBundleHeader attribute is true.
If you want to change the name of a column, you can do so either by changing the key value in the respective properties file or directly by entering the desired title in the title element.
|
If you enter a column title for which there is no key (value) in the properties file as the |
Proceed as follows
-
Open the XSLT variable of the
BPC_Assign_hookmodule in theBPC_299_PM_Configurationworkflow for editing. -
Select the XML element that generates the column that you want to change, e.g.:
-
Select one of the possible ways of changing the column title:
-
Change the column title via the properties file:
-
Remember the key that defines the value of the title element of the desired column.
-
Open the Repository tab.
-
Display the directory
ProcessMonitor > ressourceBundle. -
Open the file of the desired language, e.g.
Application_de_DE.properties, for editing. -
Search for the key that defines the value of the
titleelement of the desired column. -
Change the key value.
-
Save your changes.
-
Close the properties file.
-
-
Change the column title via the title element`:`
-
Set the value of element
useRessourceBundleHeadertofalse. The column title is no longer automatically taken from the properties file. -
Open the Repository tab.
-
As the
titleelement, enter the value of your choice to be used as the column title. -
Save the changes and publish the workflow.
-
Log off from the portal and then log on again to display the changes.
-
To use multilingualism, the element
useRessourceBundleHeaderwith the valuetruemust exist for each column. Only in this case, the change is adopted in the respective language and the language-specific value displayed as the value of the label in the Process Monitor. Otherwise, the value of title is adopted and not translated. -
Changing Status Names and Displays in the Grid
In the Process Monitor grid and on the dashboards, the different statuses of processes and log entries are displayed with different colors, names, and icons.
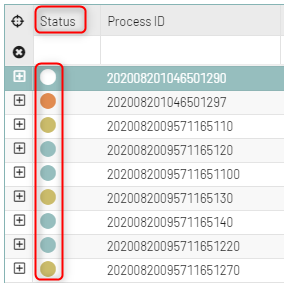
Status display in the grid
The statuses of the log entries are displayed using colored icons in Process Monitor grids:
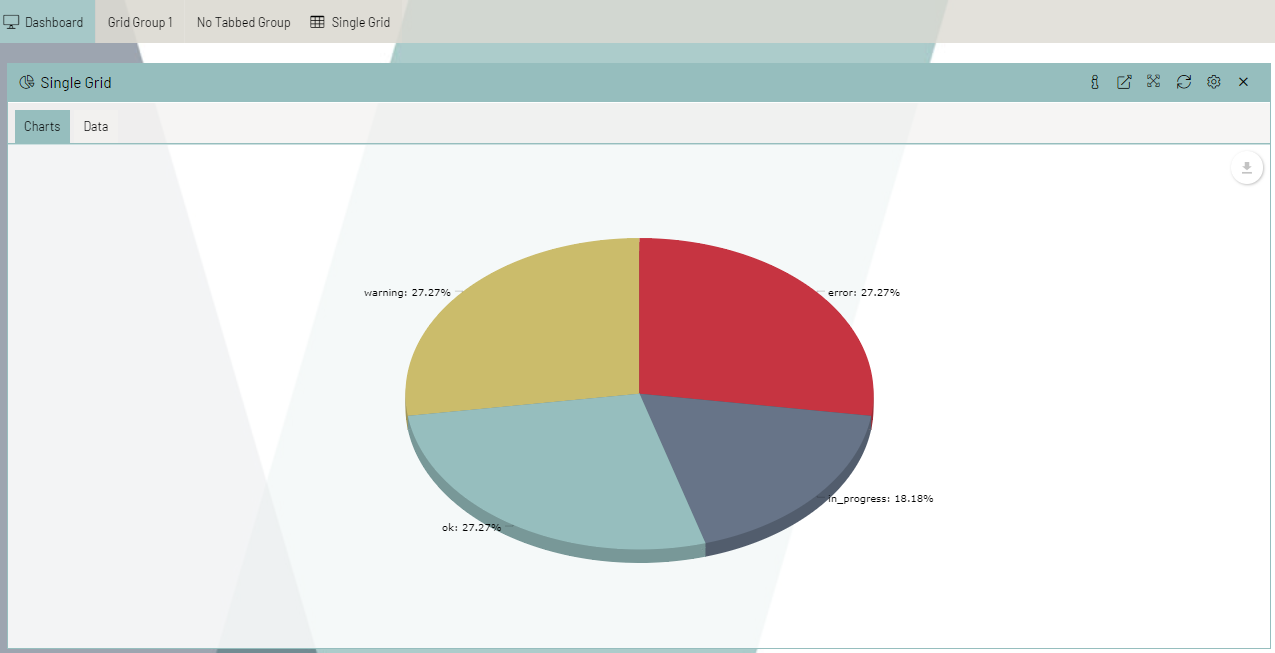
Status display on the dashboard
On the dashboard, the different statuses are color-coded:
Default status display
The default configuration provides the following statuses for monitored processes:
-
 Error
Error -
 Warning
 -
 OK
OK -
 Processing
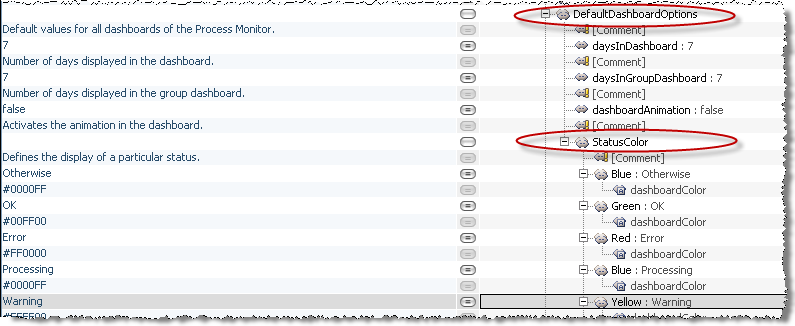
Default status configuration
The corresponding configuration in LoadInformation/ProcessMonitor/DefaultDashboardOptions/
StatusColor looks like this:
You can change the assignment of the statuses to colors, change the names of the statuses, and swap icons. If you wish, you can also display log entries without icons.
|
You have to adjust the names of the status values if your log entries contain status values other than those that have been predefined, for example, |
Proceed as follows
-
Open the XSLT variable of the
BPC_Assign_hookmodule in theBPC_299_PM_Configurationworkflow for editing. -
You define the status names, status colors for dashboard and icons as well as the graphics in the elements in the
StatusColorelement inLoadInformation/ProcessMonitor/DefaultDashboardOptions/StatusColor.The graphic to be loaded is derived from the respective element name, e.g. for the element or status
Blue, theBlue.giffile is loaded.-
Icons:
All predefined and selectable status icons are found in the repository in directory
Process Monitor > Icons >status. Your own graphics must be saved as*.giffiles. The file names must conform to the pattern[color].gif.Icons are assigned to status values based on the element name.
To change an icon, define the name of the element such that the element name and file name of the icon are the same.
Example: The file with the icon is saved under the name
down.gifin the repository. The information in the XSLTvariable is: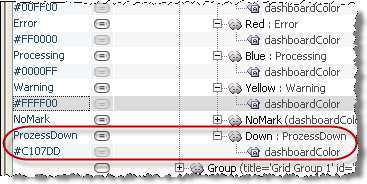
-
Status name:
The value of this element defines the name of the status.
To change the name of a status, change the value of the corresponding element.
Example: The element
Red, which defines the status with the nameError, is designated as follows in the XSLT variable: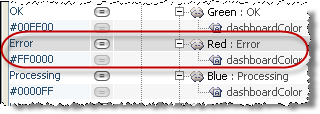
-
Status color on the dashboard:
The attribute
dashboardColorspecifies the color as a hex value for display on the dashboard.Change the value of the corresponding
dashboardColorattribute.You must perform all status changes once globally in
LoadInformation/ProcessMonitor/DefaultDashboardOptions/StatuColorand then once again for the individual grids inLoadInformation/ProcessMonitor/[…]/Grid/Data/Statusto ensure that all statuses are available globally as well as for the individual grids.
-
-
Save the changes and publish the workflow.
-
Log off from the portal and then log on again to display the changes.
Displaying Reference Files for Log Entries
For every log entry, it is possible to save a reference file, e.g. a message. In the Process Monitor grid, the download icon indicates that a message can be viewed:
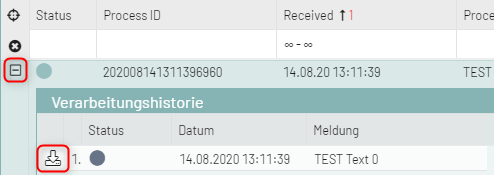
You can display and save the message by clicking the download icon.
Proceed as follows
-
Activate technical workflow
BPC_PM_Show_Reference. -
To save and display messages, you must configure the logging in your technical workflows accordingly. You can save messages either in the database or in the file system of the INUBIT Process Engine:
Refer to
Saving Messages in the Database
In the default configuration, messages are stored in the database.
To write messages to the database, you have to fill the following XML elements with values:
| XML element | Explanation |
|---|---|
|
Column in which the message is saved. Reference data is stored in the BLOB column ( |
|
Column in which the file name is saved. This defines the file name that is loaded from the grid. Required column! |
|
Save file type, e.g. |
Proceed as follows
-
Open the XSLT variable of the
BPC_Assign_hookmodule in theBPC_299_PM_Configurationworkflow for editing. -
Expand the XML destination element tree to
LoadInformation/ProcessMonitor/[Group/]Grid/Data. -
If one of the elements
Reffile,ReferenceorMimeTypedoes not exist:-
Create the element.
-
Delete the log table.
Refer to Deleting Database Tables
-
Create a new log tables.
Refer to Creating Database Tables
-
-
Fill the values with these elements according the table above.
-
Publish the workflow.
With this standard configuration, the data or message is transferred as follows: It is first checked whether in the logEntry structure a value is set for the Reffile element that can be written to the database.
If the value of the Reffile element is blank, the variable logRefFile is output, transferred to the INUBIT Process Monitor as the Workflow Connector
PM_doFunctionalLogging (in TWF PM_LogDB_Administration) and written to the database. The message is displayed in the grid when the respective icon is clicked.
|
The data of the |
Compressing Reference Data
You can save the contents of the logRefFile variable to the database in a compressed (zipped) form, thus reducing total data volume of the Process Monitor in the database. To do so, you must set the value of the zipReference variable to true.
Proceed as follows
-
In the diagram tree, navigate to technical workflow
BPC_PM_LogDB_Administration. -
Open the variable mapping at the Workflow Connector
BPC_PM_doFunctionalLogging. -
Set the value of the
zipReferencevariable in the Source area totrue.
By doing so, the reference data that is transferred by the logRefFile variable is zipped before being saved to the database.
Opening Messages in a New Window
You can display messages in a new window.
To display messages in a new window, you have to fill the following XML element with a value:
| XML element | Explanation |
|---|---|
|
Column in which you have to create the attribute |
Proceed as follows
-
Open the XSLT variable of the
BPC_Assign_hookmodule in theBPC_299_PM_Configurationworkflow for editing. -
Expand the XML destination element tree to
LoadInformation/ProcessMonitor/[Group/]Grid/Data. -
If the element
Referencedoes not exist:-
Create the element.
-
Delete the log table.
Refer to Deleting Database Tables
-
Create a new log tables.
Refer to Creating Database Tables
-
-
Create the attribute
blankfor theReferenceelement and assign the valuetrueto it (see the table above). -
Publish the workflow.
When you click the download icon, a new window opens.
Offering Actions for Log Entries
In the INUBIT Process Monitor, you can offer any actions you wish for each parent or child log entry. For example, you can show details for a log entry or start a process again if it has Error as the status.
You can use the following technique for these actions:
Asynchronous Ajax request
The action is triggered in an additional column in the Process Monitor grid using buttons. Clicking a button sends an Ajax request to an HTTP connector and starts the underlying workflow. The call is asynchronous, thus, the function that is triggered by the action button does not interrupt the application. The Process Monitor is still running while the server–by callback–processes the data that have been loaded and returns a reply to the browser. You can define the workflow as you wish.
Refer to Configuring Actions.
Configuring Actions
You can offer for each parent log entry a single action or several actions at the same time.
Offering a Single Action
You configure a single action with an action_ element and the corresponding type attribute set to the value action, respectively.
Proceed as follows
-
Open the XSLT variable of the
BPC_Assign_hookmodule in theBPC_299_PM_Configurationworkflow for editing. -
Below the
Dataelement in aGridelement, generate a new element for an action button and name it, in this caseaction_test, for example. -
Create action for parent log entry:
Add a
typeattribute with the valueaction, here for example: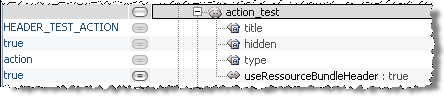
The values from all fields of the parent record are passed to the workflow with their respective column name, e.g.
action_test,action_test2,Status,ProcessID. -
To configure the desired actions for the action button, open the workflow
BPC_PM_LogMonitor_Action_AJAXfor editing. -
Replace the
Emptymodule with modules that execute the desired action. Here you can configure your desired reactions to a single action or multiple actions (two branches). -
Publish and activate the workflow
BPC_PM_LogMonitor_Action_AJAX.
Offering Several Actions at the Same Time
If you want to offer several actions for a log entry at the same time, you need a separate button for each action and a new column in the log database table for each button.
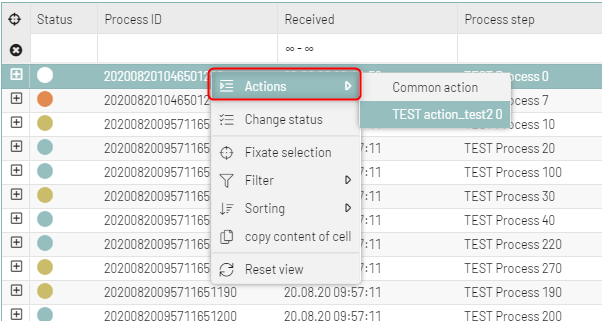
Actions are displayed in the Action column, in the context menu, and in the detail window being displayed when double- clicking an entry.
|
To display the new columns in the Process Monitor, you must delete and recreate the database tables and log off from the BPC Portal and then log on again. |
All actions are performed by sub-workflows of workflow PM_LogMonitor_Action_AJAX. To address the appropriate sub- workflow, the content of the action_ element must be evaluated. This element signalizes which button was clicked. The value of the element is always the name of the database table in which the clicked button label was saved.
You can configure how multiple action buttons are displayed, refer to Grouping Multiple Actions – MultiAction Button.
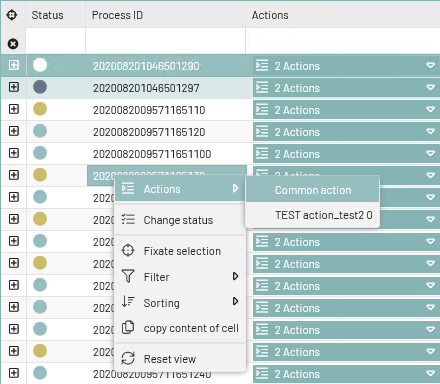
Grouping Multiple Actions – MultiAction Button
Multiple actions are displayed in the Action column, in the context menu, and in the detail window, refer to Detail Window.
For more on creating actions, refer to Configuring Actions.
Displaying the MultiAction Button for Each Log Entry
For a more convenient display of multiple action buttons for each log entry, all individual action buttons for a log entry can be grouped in a so-called MultiAction button or common action button with dropdown function. This enables you to provide multiple actions for each log entry in a grouped presentation, e.g.:
To do so, you have to make some adjustments for the MultiAction button in the configuration of the grid in the actions
element in the XSLT variable of the BPC_Assign_hook module in the BPC_299_PM_Configuration workflow.
Displaying the MultiAction Button in the Toolbar
If you want to provide or select an action for various log entries or processes simultaneously, you can display your own Actions button in the toolbar of the grid:

This enables you to, for example, select multiple processes (MultiSelect) and cancel them collectively using a corresponding Action button.
Prerequisites
In the logEntry structure the same value is used for all actions (action_*).
Manually Changing Parent Log Entries
You can manually change the status of a parent entry displayed in the grid, for instance to set the status from Error to
Warning during error analysis:

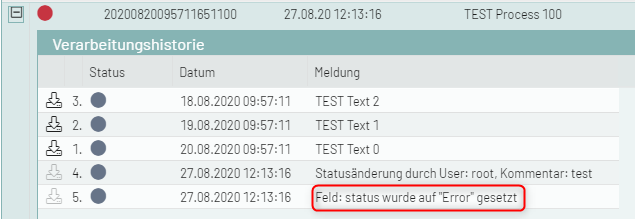
In a manual status change, a new child entry is automatically created. A comment can be added to it, and the system automatically logs which user made what status change and when.
It is also possible to select multiple processes and change their status collectively (MultiSelect).
Configuring Manual Status Changes in the XSLT variable of the BPC_Assign_hook module
In order to change the status of log entries manually, you must configure this function in the XSLT variable of the
BPC_Assign_hook module in the BPC_299_PM_Configuration workflow.
Proceed as follows
-
To display the Change status button in the grid toolbar, in
LoadInformation/ProcessMonitor/Grid/Options/statusEditorset the value of elementstatusEditabletotrue. -
In a status change, a new child entry is automatically created; you can set the status displayed for this:
In
LoadInformation/ProcessMonitor/Grid/Options/statusEditor, add any value, e.g.Infoas the value of the elementchildLogStatus: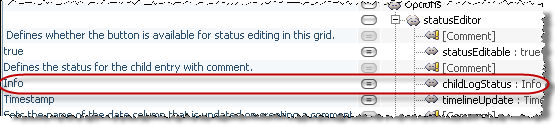
-
If appropriate, restrict the statuses that can be selected for a status change:
-
Open the XSLT variable of the
BPC_Assign_hookmodule in theBPC_299_PM_Configurationworkflow for editing. -
In
LoadInformation/ProcessMonitor/Grid/Data/Statusfor alloptionstatus elements, add aselectableattribute and set the following values:-
selectable=true, if you want the status to be available for manual status changes. -
selectable=false, if you do not want the status to be available for manual status changes.If the
selectableattribute does not exist, the valuetrueis automatically set and the status is selectable.
-
-
-
Save the changes and publish the workflow.
-
Log off from the portal and then log on again to display the changes.
Performing Manual Status Changes in the Grid
After performing the required configuration, you can perform manual status changes in the Process Monitor grid.
Prerequisites
Required configuration has been performed in the XSLT variable of the BPC_Assign_hook module in the
BPC_299_PM_Configuration workflow.
Proceed as follows
-
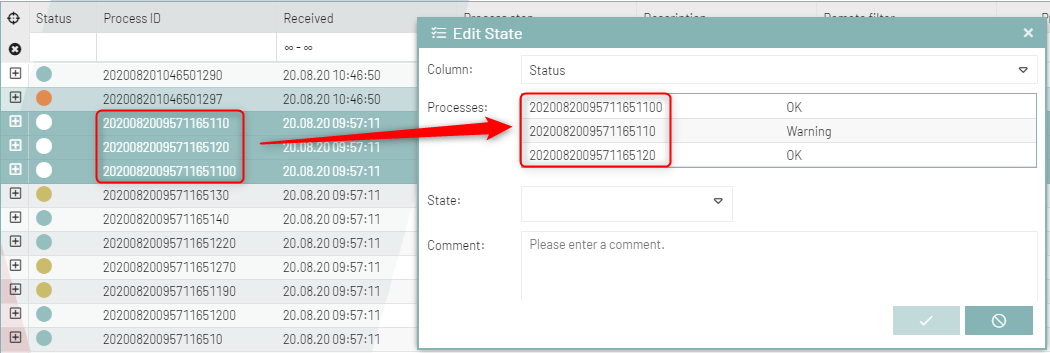
Select one or more processes or log entries by selecting the corresponding lines:
-
Click the Change status button.
→ The Edit status dialog opens.
-
Follow the instructions in the dialog and fill the required fields.
-
Change the status as desired and select a new status from the list field.
-
Click OK.
→ A confirmation is displayed.
-
Click OK. The status of the corresponding parent log entry is changed.
A child log entry is automatically created at the same time. This new child entry records which user changed the status when and any comments entered when the change was made, e.g.:
Displaying Columns with Checkboxes
In the Process Monitor grid, you can display columns with checkboxes.
A checkbox is always displayed as selected, if a value is available in the database. If the database value is Null, the checkbox is not selected.
Proceed as follows
-
Open the XSLT variable of the
BPC_Assign_hookmodule in theBPC_299_PM_Configurationworkflow for editing. -
Add to the XML element
Checkbox, through which the database column is configured atypeattribute with the value boolean`, e.g.: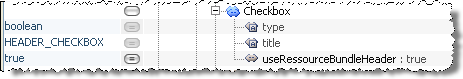
-
Publish the workflow.
-
Log off from the portal and then log on again to display the changes.
The depicted configuration ensures that the checkboxes in the respective column of the Process Monitor grid are always selected whenever there is a value in the corresponding database column.
You can modify the name of the column individually, refer to Changing the Names of Columns in the Process Monitor Grid.
Displaying Columns with List Filters
You can offer two types of list filters for columns in the Process Monitor grid: either a pre-defined set of available filter options or a dynamic list filter for configuring filter parameters.
Displaying Columns with pre-defined List Filters
You can configure columns in the grid in a way to offer a pre-defined selection list for filtering the respective column, e.g.:
You define the column types (e.g. type=status or type=listFilter) and the available filter options in the XSLT variable of the BPC_Assign_hook module in the BPC_299_PM_Configuration workflow.
Proceed as follows
-
Open the XSLT variable of the
BPC_Assign_hookmodule in theBPC_299_PM_Configurationworkflow for editing. -
In a (single) Grid element, navigate to the
Dataelement. -
In the
Dataelement, navigate to the respective element that creates the database and grid column for which you want to create and display selection filters. Here, e.g., you navigate to theStatuselement since the selection list shall be displayed in theStatuscolumn. -
Add a
typeattribute with one of the following values to the element, depending on whether you want to display a regular selection filter or a selection filter containing status information that can also have an impact on the display of icons in the grid: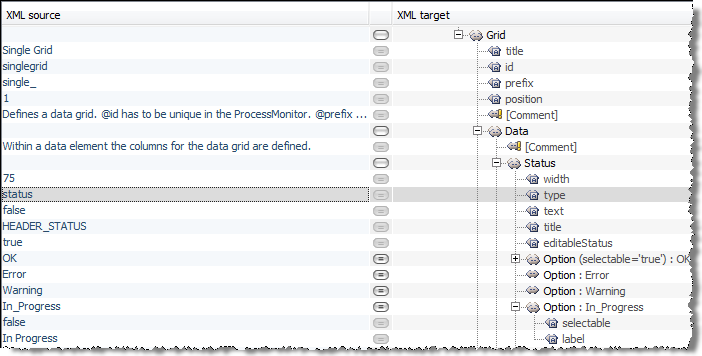
-
`type=listFilter `to offer a pre-defined selection list of filter options upon calling a filter.
-
`type=status `to offer a pre-defined selection list of filter options with status information that can also have an impact on the display of status icons in the grid.
-
-
To define the selection options offered in the portal, add a desired number of
Optionelements and enter per element a specific value that is used as option label in the Process Monitor grid, here e.g.OK,Error,Warning. -
You can overwrite the internal identifiers of the selection filter list values for making them more meaningful. To do this, add the
labelattribute to theOptionelements whose value identifier (e.g.In_Progress) you want to overwrite, and set its value to the preferredIn Progressidentifier.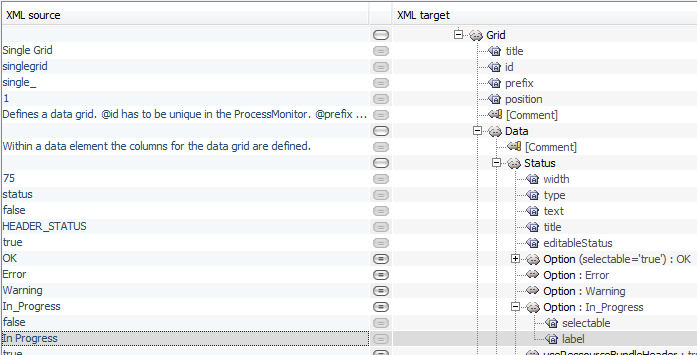
-
Publish the workflow.
-
Log off from the portal and then log on again to display the changes.
Displaying Icons in Pre-Defined List Filters
For the status column, also icons are defined. You can determine by configuration, if the icons are displayed in the filter list in addition to the filter values.
Proceed as follows
-
Open the XSLT variable of the
BPC_Assign_hookmodule in theBPC_299_PM_Configurationworkflow for editing. -
To display the icons in the filter list in addition to the filter values, set the value of the element
listFilterIcons `in the XML element `DefaultGridOptionstotrue(default):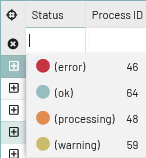
-
Publish the workflow.
-
Log off from the portal and then log on again to display the changes.
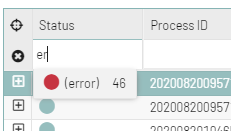
Displaying Columns with Dynamic List Filters
You can configure columns in a way to offer to grid users a dynamic selection list for defining parameters when filtering the respective column. Users have then an input field at their disposal that, after entering at least 3 letters or characters, automatically updates the filter parameter on the basis of all values contained in the respective column, thus dynamically and further restricting the filter selection, e.g.:
You define the column type type=dynamicList in the XSLT variable of the BPC_Assign_hook module in the BPC_299_PM_Configuration workflow.
Proceed as follows
-
Open the XSLT variable of the
BPC_Assign_hookmodule in theBPC_299_PM_Configurationworkflow for editing. -
In a (single)
Gridelement, navigate to theDataelement. -
In the
Dataelement, navigate to the respective element that creates the database and grid column for which you want to create and display a dynamic selection filter. Here, e.g., you navigate to theTextelement since the selection list shall be displayed in theDescriptioncolumn. -
To the
Textelement, add atypeattribute with the valuedynamicList: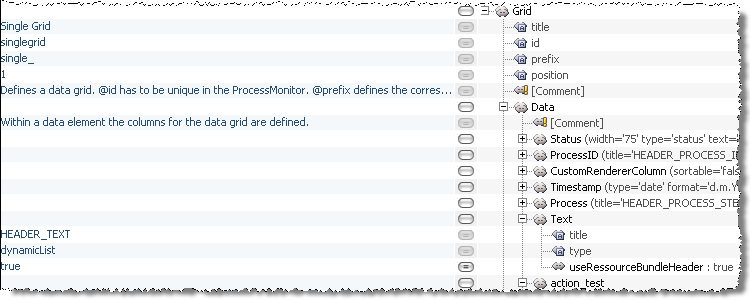
The dynamic selection filter is NOT case-sensitive. Parts of character strings are also searched without you specifying wildcards.
-
Publish the workflow.
-
Log off from the portal and then log on again to display the changes.
Dynamically Filtering Data in Other Process Monitors
By clicking in a Process Monitor grid, you can filter the data in another Process Monitor grid. With it, you can display, for example, more detailed information for a selected log entry in the second Process Monitor grid.
Filtering is triggered with the  button in the
 Filter column: In the XML configuration, you must define the parameters for the column to be filtered, the target grid to be filtered and the name of the column to be filtered.
Proceed as follows
-
Open the XSLT variable of the
BPC_Assign_hookmodule in theBPC_299_PM_Configurationworkflow for editing. -
Add the following attributes to element
remoteFilterTestinLoadInformation/ProcessMonitor/[…]/Grid/Data: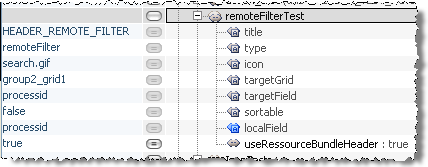
-
title: Any name for the display in the monitor -
type: You useremoteFilterto define the functionality of the column. -
icon:search.gif; graphic file displayed as a button. The graphic must be in the repository in directoryProcessMonitor > Icons. -
localField: The of the column whose values are supposed to be used for filtering. Refers to the grid in which filtering is triggered. -
targetGrid: ID of the Process Monitor grid to be filtered. You take this ID from the id attribute of the grid to be referenced, e.g.: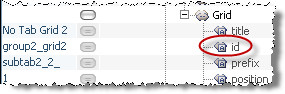
-
targetField: Name of the column whose values are supposed to be filtered.
-
-
Save and publish the changed modules and workflows.
Changing the Date Display in the Process Monitor Grid
For date columns with type date, you can change the display of the date.
Proceed as follows
-
Open the XSLT variable of the
BPC_Assign_hookmodule in theBPC_299_PM_Configurationworkflow for editing. -
Insert the attributes
formatanddb_formatto the column element:-
db_format: Date format in the database. Example:Y-m-d H:i:s.u -
format: Date format for the display. The formatting string must be valid as theformatparameter of the Ext JS functionExt.util.Format.dateRenderer. Example:d.m.Y H:i:s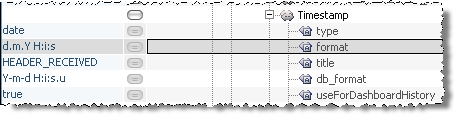
-
-
Save the changes and publish the workflow.
-
Log off from the portal and then log on again to display the changes.