Modeling Business Processes Using the Workbench
There are example diagrams for all tutorials in the INUBIT software.
Prerequisites
-
You have installed the INUBIT Process Engine & Workbench installation set.
-
You have added a valid license.
-
You have logged in to the INUBIT Workbench with the user miller in order to access to the example diagrams.
Depicting the Structural Organization
The structural organization is the hierarchical framework of a company. In the INUBIT Workbench, you visualize the structural organization using an organization diagram, showing reporting lines and the roles occupied by employees.
A complete and up-to-date organization diagram is an important prerequisite for the modeling and subsequent optimization of your business processes, since it requires the recording of all human resources, dependencies, and activities involved in the execution of a business process.
Organization diagrams
Organization diagrams consist of elements such as organization units, roles, substitutes, and people. Of course, you can also depict different structural principles of, for example, matrix or functional organizations.
Proceed as follows
-
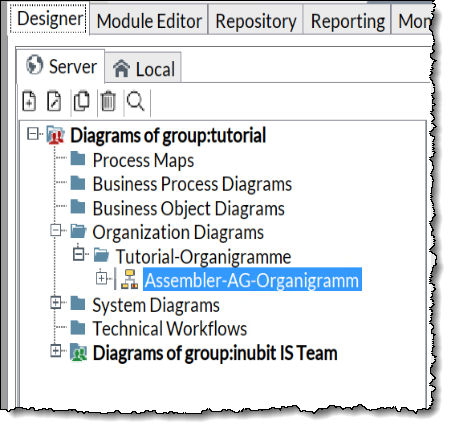
Display the Designer > Server tab in the INUBIT Workbench.
-
Open the folder Diagrams of group:tutorial > Organization Diagrams > Tutorial-Organization Diagrams.
Make sure you are logged in as user miller.
-
Click the Assembler AG Organization Diagram organization diagram.
-
Open the organization diagram for editing.
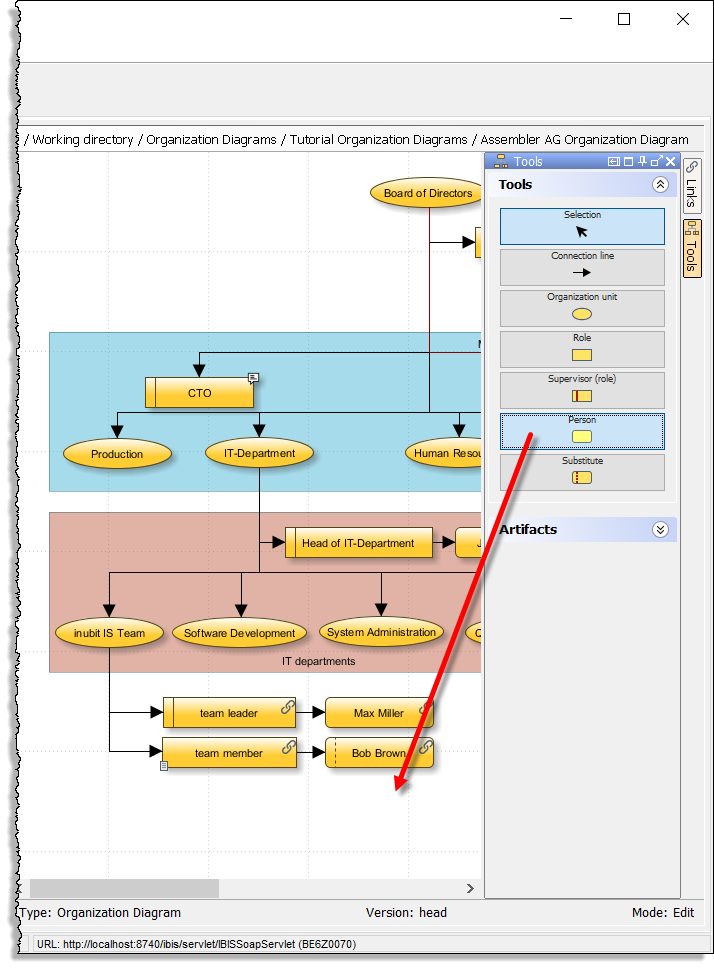
The organization diagram is displayed in the Local tab. You can now remove existing elements or add new ones.
-
Add another member to the INUBIT IS Team:
-
In the sidebar, click Tools. The Tools docking window opens.
-
Click the Person button in the sidebar and drag it onto the workspace beneath the team member that already appears there (Bob Brown).
-
Double-click the Person element. A dialog opens. Enter the name of the team member in the Name field.
-
Click OK. The dialog closes.
-
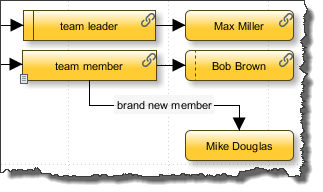
Assign the new member to the team member role by connecting the team member role element with the Person element and inserting a connection arrow.
-
To name the connection, double-click it. Enter a name in the Name field.
-
→ The result should look like this:
Providing Documents in the Organization Diagram
You can provide additional information for organization diagram elements in the form of metadata. Metadata can, for example, contain single-line or multi-line text or links to external documents with role descriptions.
Creating Metadata Types
Proceed as follows
-
In the INUBIT Workbench, display the Administration > Metadata Manager tab.
-
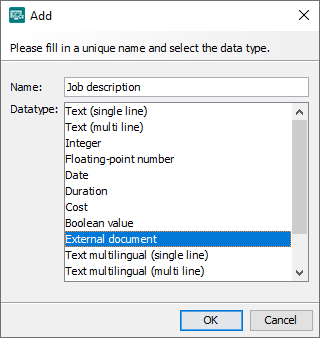
Open the context menu of the left area and select Add. The following dialog opens:
-
In the Name field enter Job description.
-
In the Datatype field select External document.
-
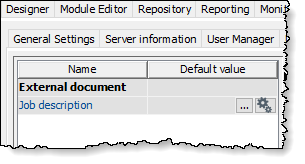
Click OK. The dialog closes and the new metadata type is displayed:
Allocating Metadata Types to Element Types
-
Use the mouse to drag the newly created metadata type to the right-hand area (Allocation to the diagram elements) and drop it onto the Role element below the Organization Diagram folder.
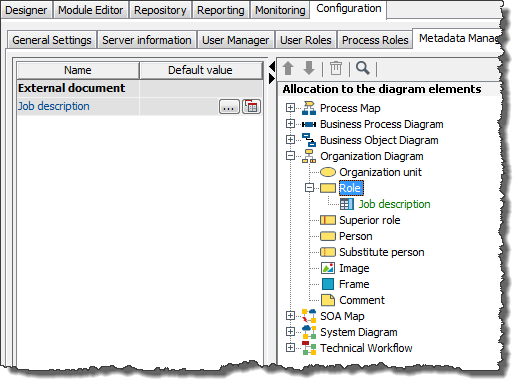
The metadata type is displayed in green below the Role element.
-
Press Ctrl+s to save the assignment. The metadata type is now displayed in black and available in all Role elements in all organization diagrams.
Defining Role Descriptions
-
To define a role description, create an organization diagram.
-
Add a new Role element named team member.
-
Double-click the team member Role element. The Element properties dialog opens.
-
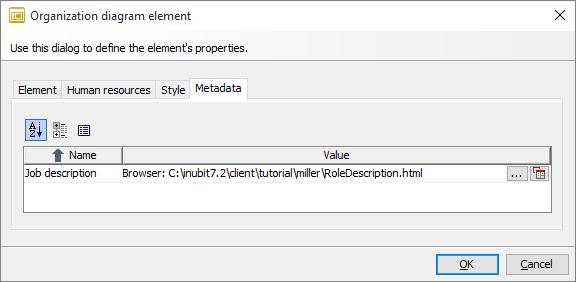
Display the Metadata tab. The metadata type you just created is displayed in the table.
-
Click the
 button.
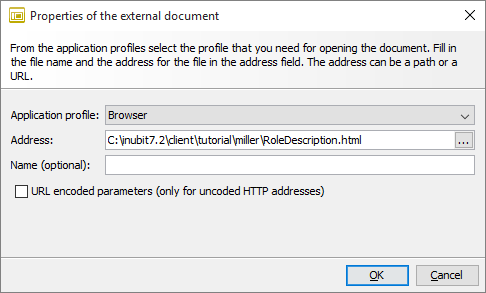
The dialog for defining the properties of the external document appears.
button.
The dialog for defining the properties of the external document appears. -
Select the Generic Application profile from the Application profile list. This profile assigns the file type to the application as registered in you operating system. On Windows systems, for example, files with the
.docextension are always associated with the MS Word application. -
In the Address field, enter the path to an (arbitrary) HTML document:
-
Confirm the dialog by clicking OK. The specified information is displayed in the Value field.
Testing External Documents
Proceed as follows
-
Click the test icon
 .
Your standard Web browser opens and displays the file and the role description.
.
Your standard Web browser opens and displays the file and the role description. -
Click OK to close the properties dialog.
→ A document symbol on the Role element team member indicates that there is an external document for this role:
+
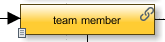
|
You can also use metadata in the form of external documents to define forms in business process diagrams that describe activities belonging to a quality management system or to define documentation on systems in system diagrams. |
Modeling the IT Organization as a System Diagram
Your company’s IT organization includes your internal IT systems (for example, your INUBIT software and your Enterprise Resource Planning (ERP) system), the external IT systems of your customers and partners, and the relationships between these systems.
You can model the entire IT organization in a system diagram, thus fulfilling an important prerequisite for simulating and optimizing your business processes. To do this, you have to enter all technical systems and dependencies as well as human resources.
Proceed as follows
-
Display the Designer > Server tab in the INUBIT Workbench.
-
Open the folder Diagrams of group:tutorial > System Diagrams > Tutorial-Systemdiagramme.
-
Display the Assembler-AG-IT-landscape diagram by clicking it.
The system diagram shows that the INUBIT Process Engine gets its data from the company’s ERP system and exchanges data with suppliers (Supplier A and Supplier B) and traders via the Internet. For security reasons, all systems are protected by firewalls.
-
Open the system diagram for editing. The system diagram is displayed in the Local tab.
-
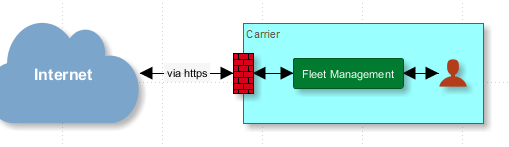
Add a Partner element. The Partner element represents a cargo company. The cargo company uses a web-based fleet management system that requires user interaction. The cargo company is also protected by a firewall.
-
Add a Partner element.
-
Change the background color of the partner element to make it easier to identify.
-
Double-click the Partner element.
-
Open the Style tab.
-
Select a color in the Background area and click it.
-
Close the dialog by clicking OK.
-
-
Connect the various elements within the Partner element with a dotted line with points at its beginning and end to differentiate internal communication from communication via the Internet.
-
Double-click the connection.
-
Display the Line type tab.
-
Configure the line.
-
Close the dialog by clicking OK.
-
-
Label the connection to the Internet with the protocol used, for example, via https.
-
Double-click the connection.
-
Enter an element name.
-
Close the dialog by clicking OK.
-
As a partner, the freight company can be modeled as follows, for example:
Modeling the Work Process Organization as a System Diagram
The work process organization comprises the business processes of a company from a business point of view. You can depict these processes in a business process diagram (BPD), thus providing a further important component for subsequent process automation.
For details about the BPD modeling elements, refer to
Drafting a Business Process
BPDs are independent of modeling methods such as LOVeM or EPC. They can therefore be used to depict the results of all modeling methods. The following procedure for the formalized depiction of a business process has been tried and tested.
Proceed as follows
-
Ask the owner of the business process about their actual procedure.
-
Document the as is state of the process. Record
-
all events starting the process,
-
all actions, which are executed, and their dependencies,
-
and all process results.
-
-
Record the most important information (such as response and processing times, quality specifications, and limitations) about the process. Among other things, the selected method determines which information is relevant.
-
Link the information as artifacts with decision points or activities.
Creating a Diagram
Proceed as follows
-
Create an empty business process diagram.
-
Make sure the menu entry Profile > Full is selected.
Depicting Organizations
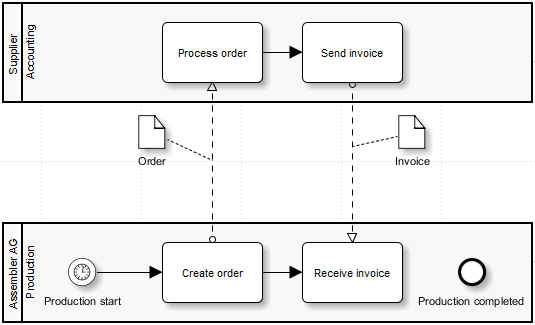
Assembler AG (department Production) and their supplier (department Accounting) are involved in the process. The two process participants are part of two different organizations. Insert a pool for each process participant.
Proceed as follows
-
In the sidebar, display the docking window Tools.
-
Open the Processes and Activities area.
-
Drag two horizontal pools into the working panel.
-
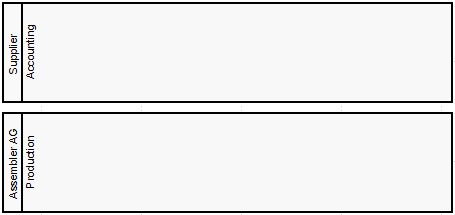
Double-click a pool and rename it to Assembler AG.
-
Do the same for the other pool, naming it Supplier.
→ The result looks like this:
Depicting Departments
The process is performed by the two departments Production and Accounting in both organizations. The departments are depicted as lanes in a pool.
Proceed as follows
-
Open the context menu of the pool Assembler AG and select Add lane. A lane is added.
-
Double-click the lane and rename it to Production.
-
Do the same with the supplier pool and name the department Accounting.
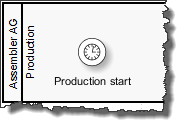
Depicting the Process Start as Start Event
The process starts periodically on the first of each month, when Assembler AG places an order with the supplier in order to request more product parts. The start event is a periodical, time event.
Proceed as follows
-
Insert a Timer start event from the Start Events panel into the Production lane.
-
Name the start event.
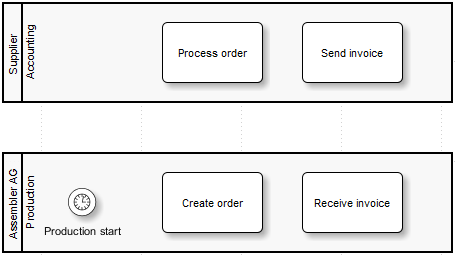
Describing the Process Steps as Tasks
Proceed as follows
-
The order process includes the following steps:
-
Assembler AG sends the order to the supplier.
-
The supplier processes the order.
-
The supplier sends an invoice to Assembler AG.
-
Assembler AG receives the invoice.
-
-
Each of these steps is depicted as a task. A task is a single-step activity that cannot be described in any further detail.
-
Insert a task for each step in each case in the lane of the department, which is to execute this task.
-
Name the steps.
The result should look like this:
-
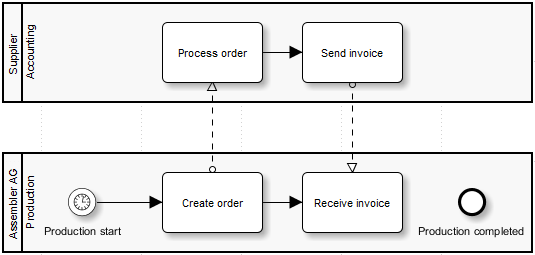
Depicting the Task Order and the Message Stream
Proceed as follows
-
Connect the tasks in each lane, thus creating a so-called sequence flow in each pool.
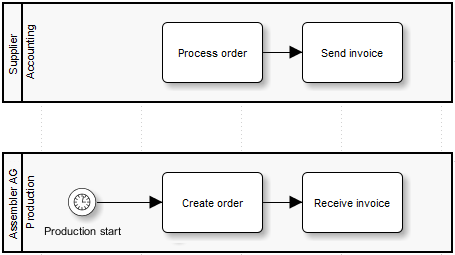
A sequence flow defines the order in which activities are executed in an organization.
Both organizations need to communicate in the order process to achieve a successful process end. This information exchange across organization borders is depicted by dashed lines.

-
Connect the tasks as given in the graphic. The connection is displayed as dashed line automatically, as soon as it crosses the pool border.
Refining Business Process Diagrams
The modeling language BPMN offers powerful constructs. Complex business processes can be depicted. This section explains data objects, sub-processes, two specific task types and intermediate events to you.
Depicting Information as Data Object
At the message streams you can specify explicitly what information is transferred.
Proceed as follows
-
Insert two data objects from the artifacts panel.
-
Name the two objects with Order and Invoice.
-
Connect the data objects with the corresponding message streams between the activities. The connection is automatically displayed as dotted line and is named Association in the BPD context.
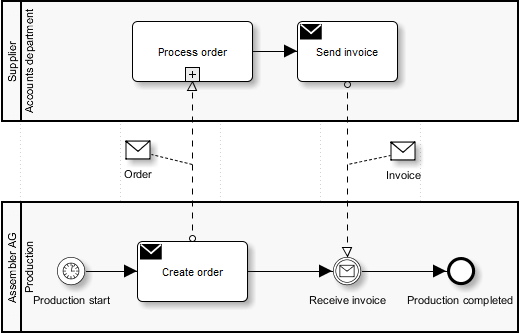
→ The result should look like this:
Converting a Task into a Sub-Process
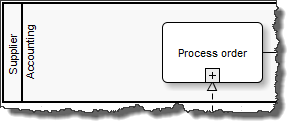
The task Process order is not really a single-step task, but rather a sequence of tasks. This element should therefore be a subprocess.
Proceed as follows
-
Open the context menu of the task Process order.
-
Select Refactoring > Convert to Sub-Process.
→ The task now is displayed as sub-process.
|
Sub-processes can be linked to other BPDs. Using this feature improves the readability of diagrams, because you can, e.g., divide complex processes into an overview and some detail BPDs and use sub-processes in the overview BPD to link to detail BPDs. |
Converting Task Types
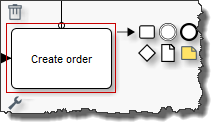
There is a more specific construction than the general Task for both tasks Create order and Send invoice. Change both tasks to the task type Task (Send).
Proceed as follows
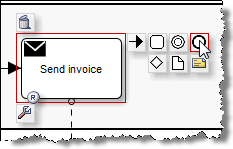
-
Click the task. A graphical context menu is displayed:
-
Point at the refactoring symbol and select Task (Send).
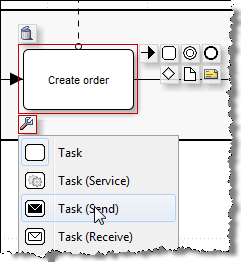
The task is displayed with an additional symbol:
-
Do the same for the other task.
Modeling Alternative: Intermediate Event instead of Task
The task Receive invoice can be replaced by a Message Intermediate Event (Catching).
Proceed as follows
-
Delete the Receive invoice task.
-
Drag the Message Intermediate Event (Catching) from the Intermediate Events panel in the Tools docking window to the former position of the task deleted before.
-
Name the Message Intermediate Event.
-
Connect the Message Intermediate Event (Catching) with the Create order task, the Send invoice task, and the Production completed end event.
-
Connect the data object Invoice with the message flow between the Create order and Send invoice tasks.
→ Now, the diagram should look like this:
+

Modeling Alternative: Message instead of Data Object
The data objects Order and Invoice can be replaced by a Message artifact.
Proceed as follows
-
Delete the Order data object and the Invoice data object.
-
Drag two Message elements from the Artifacts panel in the Tools docking window to the former positions of the data objects.
-
Name the message elements like the data object were named before.
-
Connect the Order message with the message flow between the Create order and Process order tasks.
-
Connect the Invoice message with the message flow between the Send invoice and Receive invoice tasks.
→ Now, the diagram should look like this:
Validating Diagrams
You can validate the diagram to find out if it meets the BPMN 2.0 standard.
Starting the validation
You are in the editing mode of the diagram (context menu > Edit diagram).
Click the  icon in the toolbar.
The validation returns two notes that the start event and the end event are missing in the Accounts department lane.
The notes are displayed in the Validation result window.
When you click on an entry in the window, the related element is marked in the diagram and a detailed description of the problem and notes how to solve the problem is displayed.
If you have created the diagram as described, two notes are displayed that inform you that the start event in the Accounts department lane and the end event are missing.
You must insert a start and an end event into the Accounts department lane and connect them to the respective task.
Inserting missing start event and end event
Proceed as follows
-
Drag and drop a message start event from the area Start Events onto the lane Accounts department.
-
Name the message start event.
-
Connect the message start event with the Process order sub-process.
-
Drag and drop the arrow of the message flow Order from the Process order sub-process to the message start event using the middle mouse key.
-
Click on the Send invoice task.
-
Choose the end event in the graphical context menu.
-
Name the end event.
→ Now, the diagram should look like this:
+
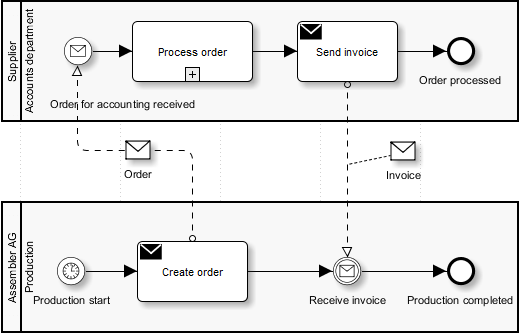
|
If you validate the diagram again now, a message should be displayed stating that the diagram is valid. |
Modularizing Business Process Diagrams: Linking Sub-Processes
You can arrange complex business process diagrams (BPDs) more clearly by depicting the process roughly in an overview BPD and then modeling the details in separate BPDs. Then, you link the detailed BPD to the overview BPD. Thus, you can structure the BPDs hierarchically.
Apart from the clearer arrangement, there is one more advantage of re-using BPDs: Process fragments can be re-used in a process and thereby standardized and quality assured.
Prerequisites
You require the BPD as an overview BPD.
If you have not created this BPD by yourself, you can find it in the folder Diagrams for user: miller > Business process diagrams > Main-Order-Transaction.
Proceed as follows
-
Open the BPD for editing.
-
Open the context menu of the sub-process element Process Order and select Refactoring > Convert to Call Activity.
-
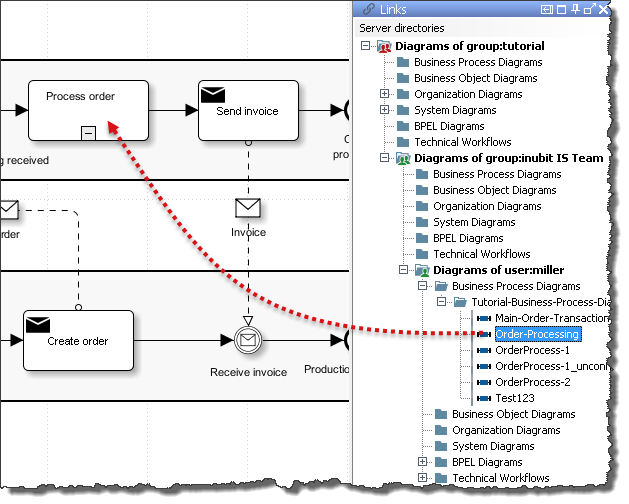
In the sidebar, open the docking window Links.
The docking window displays all diagrams available on the INUBIT Process Engine:
-
Drag the Order Processing BPD onto the Call Activity Process order. The sub-process element is highlighted. Once you drop the Order Processing BPD, a window appears displaying this BPD.
-
In the window, select the start event which you want to assign to the reusable sub-process.
-
Click OK to close the window. A dialog opens.
-
Specify if the existing name of the Call Activity should be replaced.
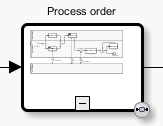
→ At the bottom right, a link point on the Sub-process element indicates that detailed information is available for the sub- process:
→ If you double-click the link symbol, the Order Processing BPD is displayed.
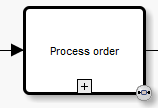
Displaying a subprocess
If you click the plus sign in the Call Activity, a thumbnail view of the BPD appears and the plus sign is replaced by a minus sign.