Reporting and Business Process Monitoring
Usage
Using INUBIT software you can turn statistical, business and technical data from the IS log database and other databases connected via Database Connectors into a graphical format and distribute it inside or outside the company.
Various types of tables and diagrams (pie charts, bar charts, line charts in various variants) are available for visualizing the data. All the presentation forms can be linked together by drill-down/drill-up to make visible the different dimensions of multi-dimensional data and to allow you to navigate smoothly through the data.
The reports can be exported as graphic, CSV or XML files.
Standard reports
Standard reports simplify the evaluation of complex data and they can be made available via the portal.
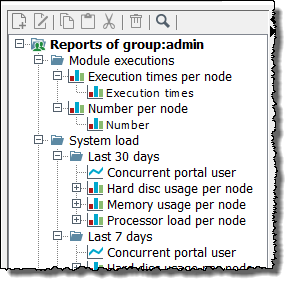
During the first server startup, various reports are automatically created:
-
Number and execution times of module executions
-
System load today/last 30 days/last 7 days
-
Number of workflow executions per user/per day with execution times
By using Drill-down, you can access the detailed data of the respective report.
|
Without a Reporting license, you can both open the Reporting tab and view existing reports. To use other functions, for example, edit, copy, import, export, or delete standard reports or to create new reports you need a Reporting license. |
Displaying reports
Reports can be displayed in the following components of the INUBIT software:
-
In the INUBIT Workbench in the Reporting tab
-
In the BPC Portal
Requirements for Reporting
-
Windows Script Host
On Windows platforms, Windows Script Host version 5.6 or higher must be installed.To determine which version of Windows Scripting Host is installed on your Windows operating system, open a command prompt then enter the command
cscript.exe. -
Rights required for creation of reports
To create reports, you require the following rights that you can view and specify in the INUBIT Workbench via Administration > User Roles:
-
Monitoring > System Log
-
Monitoring > Process Data Logger
-
Monitoring > Monitoring for group directory/ higher-level group directory
You can only create reports using data that is visible to you and your group or higher-level group!
Refer to-
-
System Log data
Workflow executions and Module executions reports are calculated from the System Log data. If you delete the System Log, all these reports are empty.
-
Creating Reports
You can create reports either by using data from the IS Log database or by using data from an external database, which must be connected to the INUBIT software by means of a Database Connector.
|
By default, the report texts are displayed in English – even if the language of the workbench is German. If you want to create additional languages for reports and their display in the portal, refer to Configuring Other Languages and refer to Adding Multi-Lingual Texts. Multi-lingual texts are used in the Portal when the report language is automatically switched to the login language of the user. |
Creating Reports with Data from IS Log Database
Proceed as follows
-
In the INUBIT Workbench, display the Reporting tab.
-
In the directory view to the left, select the group in which you want to create a new report.
The directory to the left in the Reporting tab is a server view, since reports are always directly created on the server. Thus, no local reports and no local directory view are available
-
Open the context menu and select New report…
New reports can be created on all levels of group directories.
→ A wizard opens and guides you through the process of creating the report.
Refer to
Creating Reports with Data from External Database
In order to create reports by using data from an external database, you must first connect the database to be used via a Database Connector to the INUBIT software.
Proceed as follows
-
Either open the Module Editor or the Designer and create a Database Connector.
-
Configure your Database Connector according to the requirements of the database to be used. Refer to Database Connector.
-
Publish and activate the Database Connector.
Database Connectors are only automatically offered as data source in the configuration dialog of the report, if they have been published and activated. Refer to Dialog Data.
-
Change to the Reporting tab and follow the instructions in the previous section. Refer to Creating Reports with Data from IS Log Database.
Moving Reports
You can move reports by cutting a report from one location in the directory tree and pasting it back into another location.
If you move a report to a different level in the hierarchy, the data shown in the report may also change in certain cases since the data is always drawn from tables visible to the current hierarchical level.
A report moved to a higher level becomes more extensive since the data from a larger number of users becomes accessible.
Exporting Reports and Report Data
You can either export whole reports/report groups or report data from the INUBIT Workbench.
Exporting reports
For exchanging one or more diagrams between different INUBIT installations, you can export individual reports or report groups as compressed (*.zip) XML files.
Proceed as follows
-
Display the Reporting tab.
-
Perform one of the following actions:
-
Export single report
-
In the directory tree to the left, select the report to be exported.
-
Open the context menu and select Export. A file explorer is displayed.
-
-
Export a group of reports
-
In the directory tree to the left, select the report group, your user or group folder.
-
Open the context menu and select Export. A file explorer is displayed.
-
-
-
Navigate to the directory that you want to save the export file to.
-
Click Save.
You can also initiate the export as ZIP-compressed file by selecting Export > INUBIT-Report(s) from the burger menu.
Exporting report data
You can export report data from individual reports as graphics, CSV or XML files. Data in CSV format can be directly imported in MS Excel.
Proceed as follows
-
Display the Reporting tab.
-
In the directory tree to the left, select a report.
-
On the burger menu, select Export.
-
Amongst the displayed export options select if data should be exported as graphic in JPEG format or as text in CSV or XML format.
-
Navigate to the directory that you want to save the export file to.
-
Click Save.
In order to export report data from the portal (report viewer) refer to Exporting Report Data from Portal
Using Drill-down/Drill-up
Using the technique of drill-down/drill-up you can expand or restrict the level of detail shown in the data displayed in the report, or make the various dimensions of multi-dimensional data visible, similar to zooming in and out with a camera. It is of course up to you to define how many and which levels of data or dimensions a report should contain.
Example
In a report 2nd quarter sales promotions for product group Y, the drill-up function on the Time dimension takes you to the sales promotion figures for the product group for the first half-year. Drill-down takes you to the sales figures for the individual months in the quarter. In addition, drilling-down on the Product dimension could show what percentage of the turnover was accounted for by which article within product group Y.
The use of drill-up and drill-down thus gives you the opportunity to better understand where the figures came from and makes it easier to interpret the figures.
Displaying Drill-down/Drill-up
Reports containing drill-ups and drill-downs can be used both in the INUBIT Workbench and on the intranet/Internet:
-
In the Reporting tab in the INUBIT Workbench
-
Over the intranet/Internet in the BPC Portal as report portal
Drill-down
-
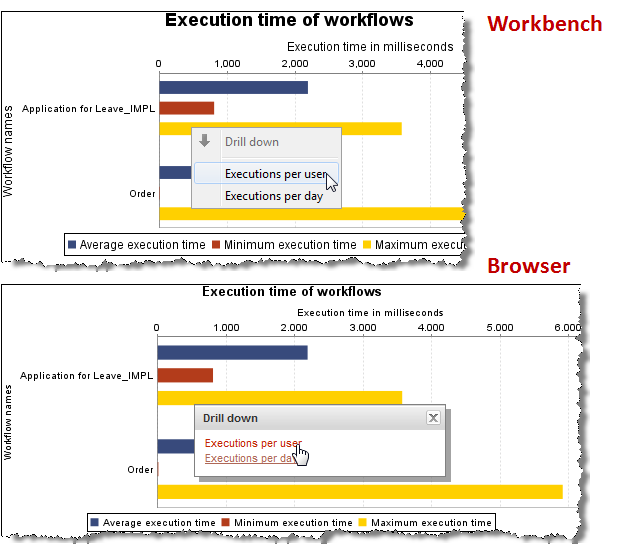
If just one drill-down report is available for a date, clicking on it opens that diagram.
-
If there are a number of linked reports, a context menu first opens for selection of one of the linked reports:
Drill-up
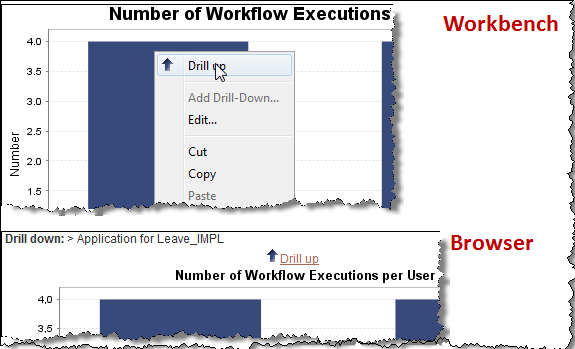
To navigate back to the base report from a lower-level report, open the context menu for the report then select Drill-up (Only available if you have displayed the report via drill-down).
Adding/Deleting Drill-down/Drill-up
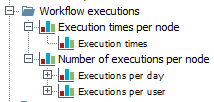
Reports with drill-down consist of two (or more) linked reports. There are a number of ways to link reports:
-
Create all the reports then link these to the base report by cut-and-paste; cut the reports that you want to link from where they are located in the directory tree and paste them back under the base report. E.g.:
-
Create a base report, select it in the directory tree, open the context menu, then select Add Drill-Down. The dialog is displayed (refer to Dialog Description: Reporting Wizard). Create a report. The new report is displayed in the directory tree below the base report and is automatically linked to it via a drill-down.
Removing a drill-up/drill-down
To remove a drill-up/drill-down, delete the relevant report or move it to another level in the hierarchy.
Linking Reports to External Web Applications
You can provide every report with an URL to an external link to jump from a report in the report viewer into another web application.
Thus, you can e.g. jump from a report that analyzes company turnover figures to another application by just clicking the dimension annual turnover in the report diagram.
The URL can be invoked by clicking the drill-down menu in the report diagram or table.
Upon clicking it, the URL automatically carries context information from the data in the clicked report, and opens the web page that displays the content generated by the HTTP-GET request.
Proceed as follows
-
In the INUBIT Workbench, open the Reporting tab.
-
Create a new report.
Refer to Creating Reports. -
Open the newly created report for editing. The General dialog is displayed.
-
Create external linking
-
Select the option Link to external Web application.
-
In the URL field, provide the URL of the desired application, e.g.
www.google.deand enter a description.
For a detailed description of the dialog fields refer to Dialog General. -
Retrieve the relevant
GETparameter name for the specified URL by searching the URL for the last displayedGETparameter with the value that is to be inserted dynamically, e.g.: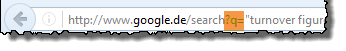
You use
HTTP-GETto transmit parameter value pairs that are to be processed by called applications, e.g. for processing a search request. Within anHTTP-GET `request, parameter value pairs are introduced in the URL by a `?, followed by the parameter name, the=character and the value of the parameter, e.g.https://www.google.de/search?q="turnover figures". -
In the URL field, enter the complete path segment with the retrieved
GETparameter name, including the=character, e.g.: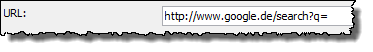
-
Click OK to save the linking.
-
-
Invoke the external linking
-
In the INUBIT Process Cockpit, open the Reporting tab and, thus, open the report viewer.
-
In the directory tree to the left, select the newly created report. The report diagram is displayed.
-
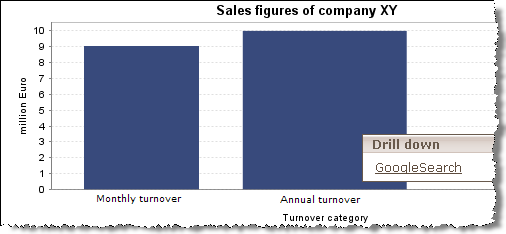
Left-click a dimension or a column. The drill-down menu displays the newly inserted URL:
-
Click the displayed name of the URL. Upon clicking, the selected dimension Annual turnover is transferred as
GETparameter to the applicationwww.google.de. The browser opens the application and displays the search results.The external web application is opened in the current browser window. You can leave the portal, then.
-
Exporting and Importing Report Texts for Translation
In order to translate report texts such as titles, table and axis labels to different languages, you can export these texts to an Excel file and import them again from the file after translation.
Multi-lingual texts are used in the Portal when the report language is automatically switched to the login language of the user.
Exporting
Proceed as follows
-
In the INUBIT Workbench, display the Reporting tab.
-
From the burger menu, select Export > Report texts. A wizard opens.
-
Select the reports.
-
Specify the file name and the location the export file should be stored in.
-
Click Next.
-
A dialog opens where you specify for which languages the translations are to be prepared. For each language, a column named
new.label.[country abbreviation]is created in the Excel file. If the labels have already been translated, an additional column namedold.label.[country abbreviation]is generated with the existing translation.-
Select a language from the list.
-
Click the +-button to save the language.
-
Repeat these steps for each required language.
-
-
Click Finish.
→ An Excel file is generated and is saved to the specified location.In the Excel file, the source texts and all target languages are each stored in an individual table column. The column containing the source texts is highlighted in yellow, while the columns containing the texts to be translated are highlighted in white.
|
Columns highlighted in yellow contain original text that must not be edited. Be sure to change only text in white columns. |
Importing
Proceed as follows
-
In the INUBIT Workbench, display the Reporting tab.
-
From the burger menu, select Import > Report texts. A file explorer is displayed.
-
Navigate to the Excel file containing the translations and open it in the file explorer.
→ If the texts are imported successfully, a confirmation messages is displayed.
Creating a Process Model Report
The INUBIT software allows you to create comprehensive documentation for your process model. To do this, you create a process model report with a few clicks of the mouse. This report offers an overview of all the used Technical Workflows and modules.
Refer to Creating a Process Model Report.
Displaying Business-Related Process Data in the Process Log
|
To display the Process Log tab you need to license the Process Data Logger module! Refer to Process Data Logger. |
Call up
INUBIT Workbench > Monitoring > Process Log tab
In the process log, data which is just being processed in workflows is displayed in real-time. You can use this data for evaluating and optimizing processes and present it graphically using external business intelligence tools or the reporting component of the INUBIT software.
Refer to Creating Reports.
Process data can alternatively be kept in the INUBIT log database (IS Log Database) or in external databases accessible via Database Connector modules: Select one log database from the Log DB list (default: IS Log Database).
The process data is collected by the utility Process Data Logger and written in a logging target. You configure the data and the logging target when configuring the Process Data Logger. Usually, a database table serves as logging target.
In the Process Log, data from several logging targets can be displayed: Select one of them from the Logging target list, containing all non-INUBIT tables in the selected database.
To fetch the values from the selected database table, click the Fetch data button. In the Number of rows entry field, specify the number of rows to be fetched (default: 100).
You can also display the Process Log in the BPC Portal.
Dialog Description: Reporting Wizard
|
By default, the report texts are displayed in English – even if the language of the workbench is German. If you want to create additional languages for reports and their display in the portal, refer to Configuring Other Languages and refer to Adding Multi-Lingual Texts. Multi-lingual texts are used in the Portal when the report language is automatically switched to the login language of the user. |
Dialog General
On the left-hand side of the dialog you can select the type of report (bar, area, line, pie, dial charts or table).
Once you have selected the report type, all variants of this report type are displayed. If you click a variant, information about it is displayed.
|
If further languages have previously been defined for the reports, green plus symbols are displayed at all input fields supporting multilingualism.
Clicking the symbol opens the dialog for entering and maintaining these languages. |
-
Name: The name does not have to be unique; there can be more than one report with the same name. The report is displayed in the INUBIT Workbench under the name that you specify.
-
Description: detailed description of the report
-
Title: Is displayed immediately above the diagram or table.
-
Group title (x-axis): (only for bar, area and line charts) is displayed along the x-axis
-
Data title (y-axis): (only for bar, area and line charts) is displayed along the y-axis
-
Alignment Vertical alignment is pre-selected meaning that the X-axis is horizontal and the Y-axis is vertical.
Transposing the axes can be useful where e.g. there are a large number of labels on the X-axis that become illegible when side-by-side.
Link to external web application
This option allows you to provide an URL to an external web application that can be invoked from the report viewer and that gets access to the web application by using context-related information.
-
Description: Field for free text entry to describe the URL that is invoked. This description is displayed as jump label in the report viewer.
-
URL: URL of the external web application with indication of the respective
GETparameter name that applies to the specified URL. The default parameter name isselectedValue.
|
Upon clicking, the parameter value (e.g. Annual turnover) is handed over dynamically as the |
For a detailed description of the option refer to Linking Reports to External Web Applications.
Dialog Data
In the Data dialog, you specify which data is to be visualized in report form.
Refer to
Data source
For selecting a data source:
-
To create a report out of INUBIT internal data, select the INUBIT monitoring database.
-
To create a report out of an external database, select a Database Connector. Every Database Connector which is published and activated in INUBIT Workbench is automatically displayed in the Data source field.
A report can only be created on the basis of one single database table or one single database view.
Tree structure to the left
Contains all database tables and views the user is entitled to use. Below the tables the available columns are listed. The following tables are default tables of the INUBIT software:
-
Module log
-
Name: Name of the module.
-
Start: Start time for the execution of a module specified in milliseconds since 01.01.1970 - can be used for the timeline and for specifying the time periods.
-
Duration: Duration of the execution of the module in milliseconds
-
Message: System messages, for example, error messages or execution messages
-
Node: Name of the node on which the execution has been carried out
-
-
System statistic log
-
Log time: Time at which the entry was written to the log
-
CPU usage: Processor usage as a percentage
-
Memory usage: Total memory usage in bytes
-
INUBIT memory usage: Use of INUBIT Process Engine memory in bytes
-
Harddisc usage: Usage of the hard disk partition on which the server is installed. In bytes.
-
Swap usage: Usage of virtual memory in bytes.
-
Processing workflows: Number of workflows currently running.
-
Portal user: Number of users that use the portal at the same time.
-
Node name: Name of the node on which the execution has been carried out
-
-
Workflow log
-
Name: Name of the workflow
-
Start: Start time for the execution of a workflow specified in milliseconds since 01.01.1970 - can be used for the timeline and for specifying the time periods.
-
Duration: Duration of the workflow execution in milliseconds
-
Message: System messages, for example, error messages or execution messages
-
Status: There are two statuses, Error = 0 and OK = 1.
-
Owner: Owner of the workflow
-
Priority: Execution priority of the workflow
-
Node: Name of the node on which the execution has been carried out
-
Display SQL data types
When selected for each database column the valid value range is displayed. You need these information to create correct and meaningful reports.
Selection (x-axis)
-
Display field
The selected columns are shown on the X-axis. Use the Display value drop-down list to define a time interval. -
Sorting (button)*
By group name: Specifies how the values are sorted on the X-axis. Original here means in the order of the values in the table column, that is, unsorted.
-
By group values: Specifies how the values on the X-axis are to be sorted in relation to the values on the Y-axis. Since several series may be displayed on the Y-axis, you first need to specify which series the sort is to be based on:
-
Based on: For selecting the series.
-
Order: Sort order of the values.
-
*Selection: Restricts the display of the values. All values may be displayed or only the first or the last n values in a series.
-
-
First N/Last N: The number of first or last values displayed (a positive integer).
-
Pool display of remaining groups: If selected, the values of the remaining groups are pooled and displayed as one group.
-
Group name: Name of the pooled group.
-
|
Change between summer and winter time! In diagrams with time axes, the value of the next hour is overwritten with the value of the previous hour when the change between summer and winter time takes place. This affects the distribution of group values using the for every hour option. |
Series/Values (y-axis)
Configure series (button): Specifies how the values are displayed:
-
Name: Name of the selected data series.
-
Calculate value: Selection of the functions that can be applied to the selected series.
-
Display value
When selected, the data in the series is displayed with the values found in the table.
Calculation factor 1/: For conversion of values when they have a format that is unsuitable for visualization. For example, to convert milliseconds into seconds or minutes enter 1000 (from milliseconds to seconds) or 60000 (from milliseconds to minutes). -
Display value in percent: When selected, the values are presented as percentages.
Base value: Specifies the value that is to represent 100%.For the report type Table, this option is called Configure column. You can individually configure the values in the report in order, for example, to highlight process states and critical values (form, color, image). To this end, you define conditions and properties in the Formatting tab. Some images are by default available, other images must be stores at
/Global/Systems/Reporting/Icons.
|
For the Dial report type, the diagram is generated like a bar diagram: Based on the x-axis value, the y-axis value is displayed by the needle. If there is more than one x-axis value, only the first value is considered and the remaining values are ignored. |
Conditions
The selected database columns are used as filters for the selected series. If more than one database column is selected, they are joined with a logical AND. The following filtering conditions are available.
-
arbitrary: No conditions specified.
-
is equal to/is not equal to: A value must be specified with which to compare the values from the series. Depending on the condition, only the values from the series that are equal to/are not equal to the specified value are displayed.
-
is less than/is less than or equal to: Only the values that are less than the specified value (or equal to the value) are displayed.
-
is greater than/is greater than or equal to: Only the values that are greater than the specified value (or equal to the value) are displayed.
-
is between: Only the values are displayed that are greater than the first value and less than the second value.
-
contains/contains not:
Only values are displayed that contain/do not contain the specified value. -
is in period: If you specify a value referring to a week, a week is understood to be from Monday to Sunday. Therefore if you select the condition current week all days in the current week from Monday to Sunday are considered.
Portal roles
For each condition, you have to activate the portal role(s) as process user roles that should be allowed to see the result. By default, no role is activated.
Dialog Options
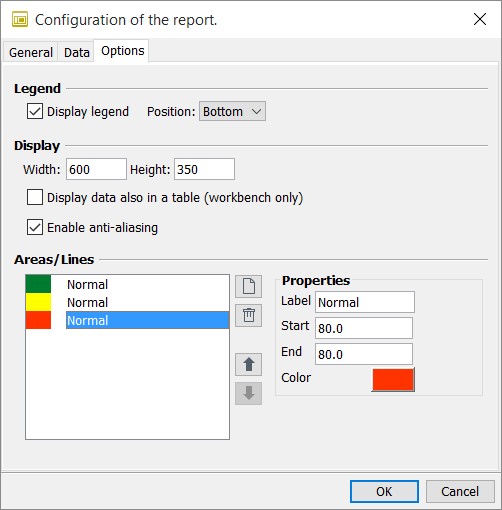
The Options dialog offers further ways in which you can configure a report.
Legend
-
Display legend: If you select this option, a legend to the data series in the report is displayed.
-
Position: You can position the legend at the top, bottom, left or right.
Display
-
Width/Height: (in pixels) gives you the option of influencing the size of the diagram.*
-
Display data also in a table:
When activated, the data that is visualized in the diagram is also displayed in a table below the diagram. -
Enable anti-aliasing: This option results in the lines in line diagrams being smoothed. If you wish to represent exact values rather than trends or progressions, this option must be deselected.
Areas/Lines
(only for bar, area and line diagrams)
With this optional feature, you can create any number of areas or lines in order to visualize control or threshold values and KPIs. If you only want to depict a line and no area, you must specify the same value for Start and End.
|
If you have selected a dial chart, the definition of areas is not optional. Under Dial chart areas you must define the different areas for the representation of data. |
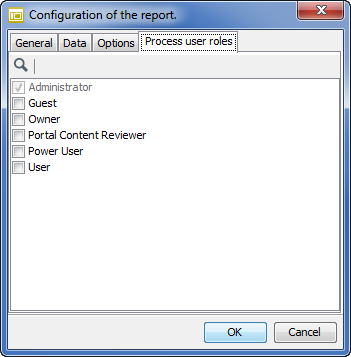
Dialog Process User Roles
|
The Process user roles dialog is only displayed when a process user server is activated! |
In the Process user roles dialog you specify which process user roles can see the current report.
A report can inherit the assignment to process user roles from a higher-level group. If the group to which the report belongs has already been assigned process user roles, the selection displayed can be further extended but not restricted.
Refer to
Comparing and Deploying Reports on/to Different Process Engines
Prerequisites
Both process engines must be installed in version INUBIT 8.0.
Proceed as follows
-
On the INUBIT Workbench, open the Reporting tab.
-
Navigate to the Reports directory for which you want to compare the reports containing in the directory and its subdirectories if any.
-
Open the context menu and choose the item Compare with another Process Engine.
-
For comparison, enter the connection details for the remote process engine. Only the IP address or the DNS name of the remote system on which the Process Engine is running must be specified as the Server name.
-
If you select HTTPS as protocol, all necessary security settings must be made by clicking on the SSL… button.
If you enter incorrect details, the wizard page will display a corresponding message. You should correct your settings until the message disappears.
-
When all the settings are correct, click Next.
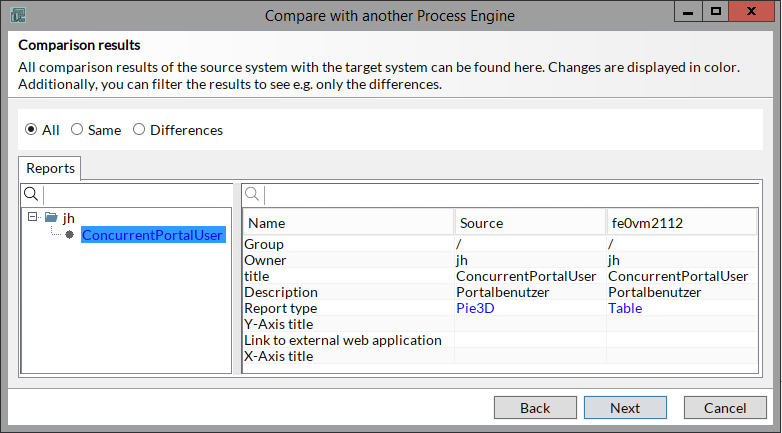
→ The Comparison results dialog is displayed.Differences between source files and target files are highlighted in color as follows:
-
Entry black: file is identical on both the source system and the target system.
-
Entry green: file is missing on the target system.
-
Entry red: file is missing on the source system.
-
Entry blue: file differs between source system and target system. Additionally, you can filter the filenames as follows:
-
All: depending on the Comparison result, all entries are highlighted in color.
-
Same: only entries that are identical on both systems are displayed.
-
Differences: only entries that differ on both systems are displayed.
-
-
To display the details, click the report name in the tree.
-
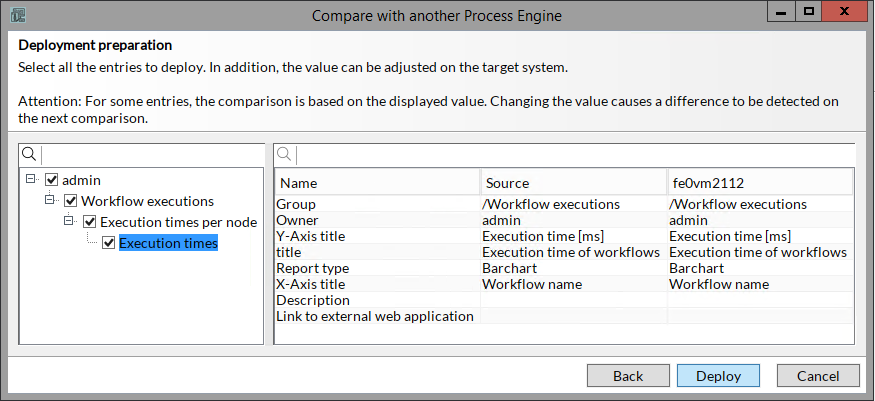
To deploy one or more reports, click Next.
-
Choose the element(s) you want to deploy.
-
Click Deploy to start the deployment.
-
Confirm the question.
→ The selected settings are deployed and a deployment protocol is displayed. -
Click Finish to end the comparing/deploying and to close the window or click Back to compare/deploy further settings.
Context Menus of Reports and Groups
This section explains the context menus for groups and reports.
Groups
-
New report: Opens the dialog for creating new reports.
-
New group: Generates a new group beneath the selected group. You can nest groups to any depth.
-
Paste: Pastes the report into the selected group. The report must have previously been put onto the clipboard by cutting or copying.
-
Export: Creates a compressed (zip) file from the group and the reports contained in the group.
-
Import: For importing reports.
-
Assign process user roles: Opens a dialog in which to specify which process user roles are to have access to the group’s reports. If the recursive for sub groups option is selected the permissions for all reports are inherited by any sub-groups.
-
Delete: Deletes the selected group together with any sub-groups and reports contained in the group.
This menu item is only displayed, if a process user server has been activated.
Refer to
-
When creating/editing a report the rights may be extended.
-
Reports
This context menu can be called in the Reporting tab when you
-
select a report
-
display a report.
Functions:
-
Add drill-down:
Refer to Using Drill-down/Drill-up. -
Edit: Opens the wizard for editing the report.
-
Cut: Deletes the report in its current location and stores it on the clipboard.
-
Copy: Stores a copy of the report on a clipboard.
-
Paste: Pastes a report from the clipboard. The report must previously have been cut from another location.
-
Assign process user role: (only displayed with activated process user server)
Opens a dialog containing a list of all available process user roles where you define which process user roles should have access to the selected report. You can remove process user roles assigned to a report group only from the report group. Independently, you can add and remove process user roles assignments to diagrams. -
Export: You can export report data from individual reports as compressed (*.zip) XML files.
-
Display workflow: If the report is linked to a BPD, you can navigate to the relevant BPD.
Refer to Linking Business Process Diagrams to Reports. -
Delete: Deletes the selected report. This action cannot be undone.