Technical Monitoring
Monitoring functions
The Technical Monitoring of the INUBIT software offers the following features:
-
Monitoring running workflows
With the Queue Manager you supervise the status of all not yet successfully finished and waiting processes. You can also stop, restart, continue and delete processes.
-
Displaying start times of scheduled workflows
In the Scheduler Manager all schedules are displayed which are configured in system connectors in active Technical Workflows.
-
Supervising all systems controlled by Watchdogs
In the Connection Manager all systems are displayed which are registered at the INUBIT Process Engine and are controlled by a Watchdog.
-
Supervising the validity of certificates
In the Key Manager you supervise the validity of certificates in your active system connectors and in partner management objects.
-
Displaying the status of finished workflows
In the System Log already executed Technical Workflows and system processes are displayed. For each entry detailed information as for example status, priority and process ID is available.
-
Supervising administrative user actions
By using the Audit Log you control the administrative actions users perform on the INUBIT Process Engine (for example log in/log off) as well as changes of modules and workflows (creating, modifying, deleting).
-
Displaying logs of the INUBIT Workbench and INUBIT Process Engine
-
Remote access to monitoring and option for remotely activating logging
Roles and rights
For monitoring workflows in group and higher-level group directories there are the rights Monitoring > Monitoring for group directory and Monitoring > Monitoring for higher-level group directory. You can activate these rights when configuring the roles included in delivery and when creating new roles.
Queue Manager: Monitoring Running Processes
Call Up
INUBIT Workbench > Monitoring > Queue Manager
The Queue Manager offers the following options:
-
Viewing the status of all not yet successfully completed and waiting processes.
-
Stopping processes, restarting them, continuing them, continuing them on another tag, or deleting them
-
Analyzing errors occurring
Information about table columns
In the Queue Manager, the following information is displayed:
| Column name | Explanation |
|---|---|
Global process ID |
Identifier. Identical to the process ID as long as it is not set explicitly. Refer to Changing the ISGlobalProcessId |
Process ID |
Unique process identifier; maximum value 2^63-1 (9,223,372,036,854,775,807) |
Action/Workflow |
Name of the workflow. |
Module name |
Module at which the process currently waits. |
Module type |
Type of the module at which the process currently waits. |
Start |
Date and time the processing was started. |
Next start |
Date and time the processing will be restarted. Only available if a scheduler has been configured. |
Status |
Status of the selected process. |
File name |
Name of the module input message. |
File size |
Size of the module input message. |
Owner |
Login name of user who created the workflow. |
Priority |
The values are specified when configuring the workflow. |
Node |
Node the process is running on. |
Possible process statuses
Processes in the Queue Manager have one of the following statuses:
| Status | Explanation |
|---|---|
Processing |
Messages are being processed. |
Waiting |
The process waits, for example at a multiplexer for another process, at a system connector, Workflow Starter or Wait module with scheduler for a specific date and time or at a Task Generator for user interaction. In this state the process does not consume any resources. |
Queued |
The process is not yet started and waits for a free workflow thread. The maximum number of parallel threads depends on your license, on the configuration of the workflow thread pool of the INUBIT software and on the parallelism settings of the diagram the process belongs to. Refer to |
Error |
An error is preventing further processing. |
Retry |
A system connector is attempting to establish a connection. |
Suspend |
Process was stopped manually. |
Configuring views and storing views
You can filter and sort table data, hide/display columns, and store the configured views.
Furthermore, you can add customized columns.
Refer to
Roles and rights
In order to manage processes in Queue Manager the role System Administrator is required.
Location for storing table data
The table data is stored in the INUBIT monitoring database.
Refer to
Publishing data
You can also make the table data available in the BPC Portal in a portlet.
Queue Manager Functions
In the Queue Manager, the following commands are found in the process context menu:
-
Stop
Opens a query dialog asking if the process should be stopped immediately or once the current module has been finished:-
Immediately: The execution is stopped immediately. The processing of the current module is not finished.
-
After the module: The execution is stopped after the module.
-
-
Stop all filtered entries
This option can be used to stop all the filtered entries having one of the following the statuses Processing and Queued. -
Start
Starts the process. -
Start immediately with file
Opens a file explorer to select the file to be used to start the process. -
Start immediately with modified file
Loads the start file and the start variables of the workflow into an editor. You can edit the start file and the variables. When you click OK, the workflow is started again using the modified data. -
Start all filtered entries
This option can be used to start all the filtered entries having one of the following statuses Suspended, Error, Waiting, and Retry. -
Delete entry (Del key)
Deletes the selected process entry. The input messages and interim results are removed as well. If you select more than one entry, you can decide for each entry if it shall be deleted, or you can delete all selected entries at once. -
Delete process
Deletes the process and all entries with the same Process ID, Module name and Status even if only one entry is selected. The input messages and interim results are removed as well.Delete process cannot be used on entries with the status Retry.
If you selected an entry with the status Suspended or Processing, only the selected entry will be deleted.
-
Delete all filtered processes
Deletes all processes matching the currently active filter criteria. -
Force tag change
For moving the tag the process is executed on.Refer to Changing a Tag During the Execution
-
Show error message
Displays the error message text. -
View process steps
Displays the completed steps of the process.If the status of a process is Processing then this function is disabled for that particular process. The logged-in user cannot see the respective workflow in his user level within the admin group and within an additional group that has been added to the logged-in user. For an overview of all process statuses, refer to Queue Manager: Monitoring Running Processes.
-
Show workflow
Displays the name of the workflow the process belongs to. After clicking on the name the workflow is displayed in Designer. -
View file
Displays the input messages of the selected process.
Creating a User-defined Variable and Displaying it as Column in Queue Manager/System Log
Proceed as follows
-
Open the Designer > Server tab in the INUBIT Workbench.
-
Open the Technical Workflow whose run time data are to be exported for editing.
-
Open the Variables docking window at the right-hand edge of the workspace.
-
Click the New button
 .
. -
Name the variable.
The variable name must be identical to the value you have specified for the user-defined column before, refer to Defining the Filter Name.
-
Select the
xs:stringtype, if necessary.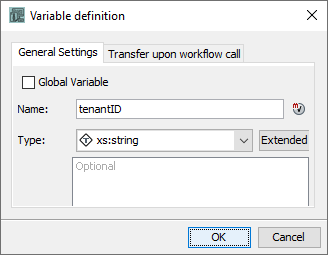
-
Add a comment, if necessary.
-
Click OK to save the new variable.
-
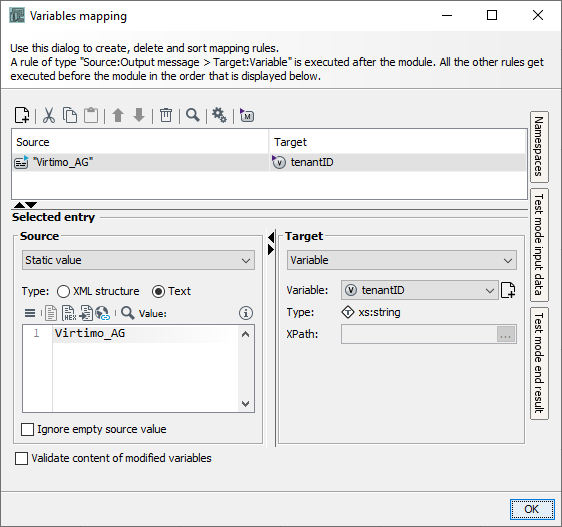
Open the Variables Mapping dialog for the module that needs the information to be moved using the context menu item Edit variables mapping.
Knowing which module needs this information depends on your workflow. If you specify a filter to export only certain run time data, e.g. data of a certain tenant, the process data are moved only if the variable is set to the expected value, e.g. the tenant name.
If the variable is not set for a process, e.g. because it is queued, it will be moved only if it has the same process ID as another process for which the variable is set, e.g. it is a sub process of the process for which the variable is set.
-
For example, select Static value for the source and set the value according to the variable.
Only alphanumeric characters are allowed in the filter name value, except for defining a path to a csv file containing process IDs.
-
Select the variable you have defined to specify certain run time data to be exported.
-
Click OK to save the variable mapping.
-
Publish the workflow.
→ The variables mapping is assigned to the module. Now, it has a V icon in the bottom left corner.
-
In the INUBIT Workbench, display the Administration > General Settings tab.
-
Open the Logging > User Defined Columns configuration category.
-
Double-click in the
Valuecolumn, in the row that is used to expand the Queue Manager or the System Log. -
Enter the name for the new column.
The name must be identical to the name of the referenced variable.
-
Save the changes to transfer the changes to the server.
→ The names assigned in the
Valuecolumn are displayed in the Queue Manager or System Log.→ The column names are only used in the Queue Manager or System Log.
→ In the dialog, the names from the Administration tab are used to hide/display the columns.
Connection Manager: Monitoring Systems
Call Up
INUBIT Workbench > Monitoring > Connection Manager
In the Connection Manager, all systems that are logged on to the INUBIT Process Engine and are monitored by a watchdog are displayed.
The following systems are automatically monitored and displayed in the Connection Manager:
-
INUBIT Workbenches
Are displayed as soon as users log onto the INUBIT Process Engine with their INUBIT Workbenches. -
BPC Portal Server
The connection is displayed as soon as users actually use an INUBIT Web Application.
You must activate the monitoring of connections to other INUBIT Process Engines and Remote Connectors manually.
Concept
Information in the Connection Manager
In the Connection Manager the following information is displayed:
| Column name | Explanation |
|---|---|
System ID |
The following information is displayed depending on the system type:
|
System type |
Type of the system for which the connection is to be monitored. |
Version |
System version. |
Status |
|
Last connection |
Date the last ping signal was received. |
Last update of license |
Date the license of the system was updated last. |
license valid until |
Date the system license expires. |
Configuring views and storing views
You can filter and sort table data, hide/display columns, and store the configured views.
Refer to Changing the Monitoring Table Views
Publishing data
You can also make the table data available in the BPC Portal in a portlet.
Location for storing table data
The table data is stored in the INUBIT monitoring database.
Refer to Managing INUBIT Databases
Activating Watchdogs for Monitoring Systems
A watchdog monitors the connection to the following systems:
-
Remote Connectors
-
Other INUBIT Process Engines
If the connection is disrupted, then this is signaled to the responsible persons, for example via mail (if configured).
For information about enabling the messaging mechanism
-
for Remote Connectors refer to Configuring the Remote Connector Log.
-
for other INUBIT Process Engines refer to Alerting.
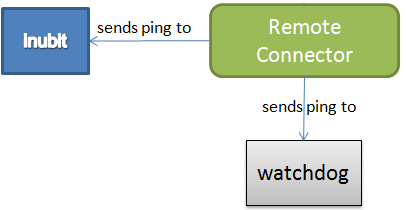
Background
For every component, a separate watchdog process is started on the computer on which the watchdog is installed.
The watchdog waits on the port (default: 8686) for a ping signal from the system to be monitored.
Due to the Ping mechanism, the monitoring system regularly checks, if the INUBIT Process Engine and the watchdog can be reached on the IP network.
|
The time interval between two pings (default: 300 seconds) can be configured in the Add connection dialog (Monitoring > Connection Manager > Add context menu). |
If the INUBIT Process Engine has not received ping signals for three times in a row, the respective connection in the Connection Manager will receive an Error status.
If the watchdog has not received ping signals for three times in a row, it generates an entry in the watchdog.log, sends a message (provided the e-mail notification mechanism is enabled), and ends automatically.
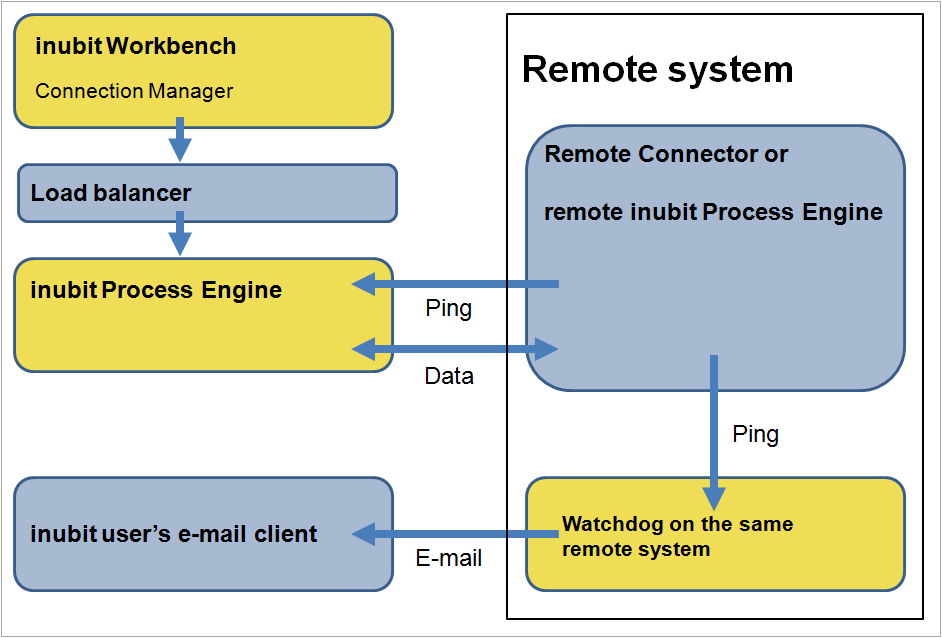
The following ports are used:
-
8000: To ping the INUBIT Process Engine from the Remote Connector or the remote INUBIT Process Engine this port must be open on the system where the INUBIT Process Engine is installed -
8585: To send data from the INUBIT Process Engine to the Remote Connector or the remote INUBIT Process Engine this port must be open on the remote system -
8686: To ping the watchdog from the Remote Connector or the remote INUBIT Process Engine this port must be open on the remote system
Requirements
The system to be monitored has already started.
Starting a Watchdog
Proceed as follows
-
Display the Monitoring > Connection Manager tab.
-
Open the context menu of the table and select Add. A dialog is displayed.
-
Select the URL of the component to be monitored.
-
If necessary, adjust the URL of the local INUBIT Process Engine. The system to be monitored must have access to the local INUBIT Process Engine via this URL.
-
Optionally: To establish a secure connection with the selected component, click SSL. The dialog for configuring the server and client authentication opens (refer to Dialog SSL Configuration).
-
Define the time interval between the ping signals.
-
Test the port.
-
Click Finish.
→ The watchdog is started; if there is an error function in the monitored system, the status is set to Error after three times the length of the interval.
Stopping a Watchdog
Proceed as follows
-
Display the Monitoring > Connection Manager tab
-
Select the system that you no longer want to monitor.
-
Open the context menu and select Delete.
→ The watchdog process is stopped, the connection to the selected system is canceled and no longer displayed in the table of the Connection Manager.
Monitoring INUBIT Process Engines by Remote Computers
If you activate a watchdog for an INUBIT Process Engine in the INUBIT Workbench, then the watchdog will run on the same computer as this INUBIT Process Engine. In case this computer fails, monitoring the INUBIT Process Engine is no longer possible. You therefore have the option of monitoring an INUBIT Process Engine by means of a script from a remote computer.
|
You need to install an INUBIT Workbench on the remote computer. |
Proceed as follows
-
Open the script in the directory
<SUITE-INSTALL-DIR>/inubit/client/bin/check_is_status.[bat|sh]. -
Enter in the row
set START_URLthe URL of the INUBIT Process Engine to be monitored. -
Start the script.
→ When executing the script, the INUBIT Process Engine is tested to determine whether the script was executed and if a login was successful.
If this is the case, 0 is returned; if an error occurred, a 1 is returned.
Updating Monitored Components
Requirements
-
The component to be updated has a different version from the INUBIT Process Engine.
-
Access and write rights are required for the remote component.
Proceed as follows
-
To update other INUBIT Process Engines using the INUBIT Workbench, select one of the following options:
-
Updating the component system files Here, the files
ibis.jarandibis_tools.jarfrom the directory<SUITE-INSTALL-DIR>/inubit/server/ibis_root/conf/deployare compared to the component files in the directorylib(for the fileibis.jarthe version is compared, and foribis_tools.jarthe size is compared). If the files currently on the components have a lower version/different size, then an update is started. -
Transfer manually drivers or plug-ins you developed yourself.
-
-
To update a Remote Connector, replace the new libraries, drivers etc. manually on the Remote Connector, restart the Remote Connector, and reconfigure the Remote Connector in the Connection Manager.
Starting Upload
Proceed as follows
-
Display the Monitoring > Connection Manager tab.
-
Select the component to be updated.
-
Open the context menu:
-
to update Remote Connectors or INUBIT Process Engines, select Update System Libraries.
This command installs updated system files on the selected component.
After the installation is complete, Remote Connectors are automatically restarted; the INUBIT Process Engine must be rebooted manually.
-
To load self-developed plug-ins or drivers on the INUBIT Process Engine, select Upload Library.
→ A login dialog is displayed.
-
-
Log in and start the update.
|
Note that it is not possible to perform two uploads in parallel! |
Log in to Monitored Component
In the Connection Manager, you can log in to a watchdog-monitored system in order to configure it.
Requirements
-
A user account for the components is available.
-
The component is monitored by a watchdog and has an
OKstatus. -
The component and the INUBIT Workbench used to log in should have the same patch level. A warning will be displayed if that is not the case.
Proceed as follows
-
Display the Monitoring > Connection Manager tab.
-
Select the component you wish to log in to.
-
Open the context menu and select Log in. A login dialog opens.
-
Enter the user identification used to log in.
-
Click Log in.
→ You are logged in to the component. The INUBIT Workbench is updated. In the user menu in the toolbar of the INUBIT Workbench your current username, your current user group and the URL of the component are displayed.
Logging out
To logout from the component, select File > Exit Server.
Starting Monitored Remote Connectors
Prerequisites
This function is only available for Remote Connectors with a status of OK.
Proceed as follows
-
Display the Monitoring > Connection Manager tab.
-
Select the Remote Connector to be restarted.
-
Open the context menu and select Restart.
→ The Remote Connector and the watchdog process are first stopped and then restarted. In Windows systems both processes are only visible in the Task Manager.
Stopping Monitored Remote Connectors
Prerequisites
This function is only available for Remote Connectors with a status of OK.
This option is especially useful for Windows systems: after a restart via the INUBIT Workbench, the Remote Connector and watchdog processes are only visible in the Task Manager as Java processes among (possibly) many others, but no longer in their own DOS prompt. With the Stop option it is still possible to target the right process to be stopped.
Proceed as follows
-
Display the Monitoring > Connection Manager tab.
-
Select the Remote Connector to be stopped.
-
Open the context menu and select Stop.
→ The Remote Connector and its watchdog process are stopped. In Connection Manager the Remote Connector is displayed along with an error status.
Scheduler Manager: Scheduled Processes
Call Up
INUBIT Workbench > Monitoring > Scheduler Manager
The Scheduler Manager displays all schedules which are configured in system connectors in Technical Workflows.
Refer to Dialog Scheduler
You can modify the configuration of the schedules as well as display and start technical workflows.
Table columns
In the Scheduler Manager, the following information is displayed:
| Column name | Explanation |
|---|---|
Workflow name |
Name of the workflow for which a scheduler has been established. |
Module name |
Name of the system connector to which scheduler is configured. |
Tag |
Name of the tag the workflow execution is based upon. |
Module type |
Type of system connector (e.g. FTP Connector) |
Scheduler status |
Active, Inactive, Workflow/Module not active |
Next start |
Date of the next processing in the schedule. |
Owner |
Owner of workflows where the scheduler has been established. |
Configuring views and storing views
You can filter and sort table data, hide/display columns, and store the configured views.
Refer to Changing the Monitoring Table Views
Publishing data
You can also make the table data available in the BPC Portal in a portlet.
Location for storing table data
The table data is stored in the INUBIT monitoring database.
Refer to Managing INUBIT Databases
Enabling and Disabling Schedulers
|
Input System Connectors: When you disable the scheduler of an input system connector, then the applicable workflow is not able to process any messages and the incoming messages are saved in the Input Queue. Output System Connectors: When you disable the scheduler of an output connector, then the messages to be sent are collected in the output queue of the workflow or sent directly after finishing the workflow process. |
Proceed as follows
-
In the Scheduler Manager select the scheduler process to be enabled or disabled.
-
Open the context menu and select Activate Scheduler or Deactivate Scheduler.
→ The scheduler status will switch to
ActiveorInactive.
Displaying the Configuration of the Scheduler
Proceed as follows
-
In the Scheduler Manager select the scheduler process to see the configuration.
-
Open the context menu and select Show Configuration.
→ For the active schedule, a dialog opens that displays the processing schedule. For an inactive schedule, a message is displayed that no schedule is active.
Change Configuration of the Scheduler
Proceed as follows
-
In the Scheduler Manager select the scheduler process for which the schedule is to be changed.
-
Open the context menu and select Change schedule.
→ After confirming the dialog, the schedule of the system connector is opened in the Editor module. The scheduler can now be edited.
|
Remember to republish the system connector after editing, if necessary. |
Starting Scheduled Processes
Proceed as follows
-
In the Scheduler Manager select the scheduler process to be started.
-
Open the context menu and select Start process immediately.
Displaying Technical Workflows for Processes
The applicable Technical Workflow may be displayed for all scheduled processes.
Proceed as follows
-
In the Scheduler Manager, select the scheduler process to see the Technical Workflow.
-
Open the context menu and select Show Workflow.
→ The Technical Workflow is displayed in Designer.
Key Manager: Managing Certificates Centrally
Using the Key Manager
Call Up
INUBIT Workbench > Monitoring > Key Manager
The Key Manager monitors the temporal validity of all certificates used by active System Connectors, including all objects of the partner management.
If a certificate expires, you can exchange it in the Key Manager by loading a new truststore or keystore file.
Table columns
In the Key Manager, the following information is displayed:
| Column name | Explanation |
|---|---|
Module name |
Name of the system connector |
Property name |
Property name of the system connector containing the key. Use the property name to access the property. |
Property description |
Provides technical information about the property. |
Module type |
Type of the system connector |
Key URL |
URL of the system connector |
Key validity |
Expiration date of certificate |
Serial number |
Serial number of certificate |
Subject |
Subject of certificate |
Owner |
Name of the user who created the system connector. |
|
When having imported an AS4 Connector module created with an INUBIT version before 6.1.0.101 or 7.1.0.33, the entries about the certificate information won’t be available on the Key Manager tab because the needed properties |
Configuring views and storing views
You can filter and sort table data, hide/display columns, and store the configured views.
Refer to Changing the Monitoring Table Views
Publishing data
You can also make the table data available in the BPC Portal in a portlet.
Location for storing table data
The table data is stored in the INUBIT monitoring database.
Refer to Managing INUBIT Databases
System Connectors with Key Manager functionality
| No | System Connector | Option to upload keys | Displayed in Key Manager |
|---|---|---|---|
1 |
AS2 Connector |
Yes |
Yes |
2 |
AS4 Connector |
Yes |
Yes |
3 |
FTP Connector |
Yes |
Yes |
4 |
HTTP Connector |
Yes |
Yes |
5 |
INUBIT IS Connector |
Yes |
Yes |
6 |
LDAP Connector |
Yes |
Yes |
7 |
Mail Connector |
Yes |
Yes |
8 |
RabbitMQ Connector |
Yes |
No |
9 |
REST Connector |
Yes |
Yes |
10 |
RosettaNet HTTPS Connector |
Yes |
No |
11 |
Security Token Service |
Yes |
Yes |
12 |
Web Services Connector |
Yes |
Yes |
13 |
WebDAV Connector |
Yes |
Yes |
|
Most of the System Connector have a Remote Connector feature. Keys used in a Remote Connector are displayed in Key Manager. |
Updating Certificates in the Key Manager
Prerequisites
For accessing System Connectors configured as Remote Connectors, you must have a user account for the remote computer!
Proceed as follows
-
Open Monitoring > Key Manager tab.
-
Select the System Connector whose certificate is to be renewed.
-
Open the context menu and select one of the following commands:
-
Update module (HEAD version)
For loading a certificate and using it immediately. A dialog is displayed.
Provide a new certificate/private key file that should update the module. This update will be applied as a new module version. If an active tag is set, it will remain with the current key data.
Select a new truststore file and load it.
→ After the key is updated, a new version of the module is created.
-
Update module later (Activate tag or HEAD version)
For loading a certificate and using it later from a selected point in time on.
A dialog is displayed. The dialog’s title always complies with the module type and name.
Provide a new certificate/private key that should update the module. This update will be applied to the active tag version (if set) or to the current HEAD version without creating a new module version.
-
Select a new truststore file and load it.
-
Define the starting date and time of the certificate.
The Workbench’s date and time are displayed in the dialog.
When having restarted the Process Engine before the given date and time has elapsed, the modules and workflows using this certificate have to be deactivated and activated again in order that the certificate can be used.
-
-
-
Click OK to close the dialog.
Webservice Manager: Managing Webservice Connectors
Call Up
INUBIT Workbench > Monitoring > Webservice Manager
The Webservice Manager displays all Webservice Connectors which have been configured in Technical Workflows.
Table columns
In the Webservice Manager, the following information is displayed:
| Column name | Explanation |
|---|---|
Workflow name |
Name of the Technical Workflow in which the Webservice Connector has been configured. |
Module name |
Name of the Webservice Connector. |
Tag |
Name of the tag the workflow execution is based upon. |
Module type |
Type of Webservice Connector. |
Scheduler status |
Active, Inactive, Faulty, Workflow not active |
Owner |
Owner of Technical Workflows where the Webservice Connector has been established. |
Configuring views and storing views
You can filter and sort table data, hide/display columns, and store the configured views.
Refer to Changing the Monitoring Table Views
Publishing data
You can also make the table data available in the BPC Portal in a portlet.
Location for storing table data
The table data is stored in the INUBIT monitoring database.
Refer to Managing INUBIT Databases
Retrying the Faulty Registration of Web Services
You can retry the faulty registration of web services.
Proceed as follows
-
Open Monitoring > Webservice Manager tab.
-
Select the Webservice Connector with the faulty registration to be re-registered.
-
Open the context menu and select Retry registering.
→ The scheduler status will switch from Faulty to Active.
Audit Log: Monitoring User Actions
Call Up
INUBIT Workbench > Monitoring > Audit Log
With the Audit Log, all administrative actions that users execute on the INUBIT Process Engine can be monitored (e.g. login/logout), as well as changes to module and workflow configurations.
All actions are displayed along with user, time stamp and context information, making it possible to determine at any time who did what when.For the actions Login and Logout the audit log also contains the user’s user group/additional user group information.
Table columns
In the Audit Log the following information is displayed:
| Column name | Explanation |
|---|---|
Action |
Actions triggered by a user. |
Object name |
Name of the object that triggered an action is displayed. If the action was executed in su mode, then the name of the parent user is shown behind the name of the object in brackets. If an object has been moved from a user (group) to another user (group), the previous user (group) and the new user (group) is displayed next to the object name, each separated by a slash. If an object has been renamed, a slash and the previous name are displayed next to the new name. If an object located in a user group has been created or renamed, the user group name is displayed in double parentheses at the end of the entry. |
Time |
Date the action was triggered. |
Status |
Possible values: In case of |
Message |
In case of In case of Example: |
User |
Name of user who triggered the action. Only those users who were created in the same or in a subordinate group are displayed. |
Location for storing table data
The table data is stored in the INUBIT monitoring database.
Refer to Managing INUBIT Databases
Configuring Audit Log
The table data is stored additionally in the Audit log in the file system. You can configure the maximum size of the Audit log file and the number of backups.
Refer to Configuring Audit Logs
Configuring views and storing views
You can filter and sort table data, hide/display columns, and store the configured views.
Refer to Changing the Monitoring Table Views
Publishing data
You can also make the table data available in the BPC Portal in a portlet.
System Log
Call Up
INUBIT Workbench > Monitoring > System Log
The System Log displays the Technical Workflows and system processes already executed. For every entry detailed information, such as status, priorities, and process IDs is available.
From the System Log, it is possible to display the workflows, their process steps, and any existing error messages. Additionally, it is possible to filter and sort log entries and to customize them to the log tables.
Table columns
In the System Log, the following information is displayed:
| Column name | Explanation |
|---|---|
Global process ID |
Identifier. Identical to the process ID as long as it is not set explicitly. Refer to Changing the ISGlobalProcessId |
Process ID |
A number, maximum value 2^63-1 (9,223,372,036,854,775,807), that uniquely identifies the workflow process. |
Action/Workflow |
System action or Technical Workflow name |
Tag |
Displays the tag under which the workflow was executed. |
Input module |
Name of the first module in the Technical Workflow. |
Output module |
Name of the last module in the Technical Workflow. |
Size of the input file |
In bytes. |
Size of output file |
In bytes. |
Start |
Date and time the workflow was started. |
End |
Date and time the workflow was finished. |
Duration |
Total modules execution time (end time minus start time) in milliseconds. |
Status |
Two possible values: |
Message |
If the workflow processing has |
Owners |
Displays the login name of the person who created the workflow. |
Priority |
Displays the priority allocated to the Technical Workflow during configuration. |
Node |
Node on which the action was executed. |
Location for storing table data
The table data is stored in the INUBIT monitoring database.
Refer to
Configuring System Log
The table data is stored additionally in the Audit log in the file system. You can configure the maximum size of the system log file and the number of backups.
Refer to Configuring System Log
Configuring views and storing views
You can filter and sort table data, hide/display columns, and store the configured views.
Furthermore, you can add customized columns.
Refer to
Publishing data
You can also make the table data available in the BPC Portal in a portlet.
Displaying Process Steps
In the System Log, it is possible to display detailed information about the individual, already finished steps and the associated Technical Workflows for every process.
Proceed as follows
-
Open Monitoring > System Log tab.
-
Select the process the details of which are to be displayed.
-
Open the context menu and select View Process Steps. Alternatively, double-click the process.
For every process, a dialog opens. You can display several process step windows simultaneously.
The following information is displayed in addition to the workflow:
Column name Description Workflow name
Name of the workflow that belongs to the process steps
Module name
List of all modules participating in the workflow
Previous
Previous module, if available
Next
Next module, if available
Message
Error message, if an error appeared in the first module of the row To select next error message, open the context menu at Message and click Next Error.
Start
Date and time the execution of the module was started
End
Date and time the execution of the module ended
Duration
Total modules execution time (end time minus start time) in milliseconds.
Node
Node on which the action was executed.
-
To find the details of a specific module in the table more quickly, click Technical Workflow in the module. The corresponding entry is color-coded in the table.
Displaying Error Messages
The error messages for every process completed with errors is displayed in the System Log.
Proceed as follows
-
Open Monitoring > System Log tab.
-
Select the process for which the error message should be displayed.
-
Open the context menu and select Show Error Message.
→ An error message is displayed.
Displaying Workflows
Displays the name of the selected workflow. Clicking on the name displays the workflow in Designer.
Proceed as follows
-
Open Monitoring > System Log tab.
-
Select the workflow to be displayed.
-
Open the context menu and select Show Workflow. The name of the workflow is displayed; click it.
→ The Technical Workflow is displayed in the Designer tab.
Displaying Message Logs
This function lists all archived input and output messages and displays them.
Prerequisites
Input/Output Message Logging is activated at the module and/or at the diagram.
|
Input/Output message logging is possible at System Connector modules only. |
Look at Input/Output Message Logging
-
on the diagram: refer to Execution Tab - TWF Only
-
on the module: refer to Dialog System Connector Properties
Restarting Processes
You can select a message, which was already processed, to start a workflow again.
Prerequisites
Input/Output Message Logging is activated at the module and/or at the diagram.
Look at Input/Output Message Logging
-
at the diagram: refer to Execution Tab - TWF Only
-
at the module: refer to Dialog System Connector Properties
Proceed as follows
-
Start the entire workflow
-
Select Start process again with > Input.
All input messages are listed, which were archived by the Input/Output Message Logging.
-
Select a message.
→ The selected message is used to start the workflow execution directly after the Input System Connector.
-
-
Start the Output Connector again
-
Select Start process again with > Output.
All output messages are listed, which were archived by the Input/Output Message Logging.
-
Select a message.
→ The Output System Connector is started again with the selected message.
-
Server Trace Log: Displaying Server Traces
Call Up
INUBIT Workbench > Monitoring > Server Trace Log
When the Server Trace Log is activated, all logged messages and errors of the INUBIT Process Engine can be displayed and stored here. All available log files are displayed in the combobox with the date and timestamp of that respective file.
Configuring and activating the Server Trace
You can configure the maximum size of the log and the number of backups, amongst others.
Viewing / Storing the Server Trace
Select the log file in the combobox you want to view / save:
-
Click on the view icon to load the selected log file into the Server panel or use the context menu.
-
Click on the download icon or use the context menu to save selected log file as
*.logor*.txtfile.
You can also mark parts of the trace log and copy / save them using the context menu.
Refreshing the Server Trace
-
Click on the toolbar refresh icon to reload the log file displayed in the panel or use the context menu.
-
Click on the menu bar refresh icon to refresh combobox details or the list files. The content in the panel will not be refreshed.
Closing the Server Trace
Click on the close icon to close the log file displayed in the panel or use the context menu.
Searching the Server Trace
Use the context menu or refer to Tab-wise Search
Webservice Log
Call Up
INUBIT Workbench > Monitoring > Webservice Log
When the Webservice Log is activated, all logged messages and errors of the Web Service Connectors can be displayed and stored here. All available log files are displayed in the combobox with the date and timestamp of that respective file.
Configuring the user roles for accessing the Webservice logs
Accessing the Webservice logs is restricted. Users without the right to access the Webservice logs cannot see the Webservice Log tab.
You must configure the user roles that should have the right to access the Webservice log (refer to Managing User Roles).
|
The System Administrator user role has this right by default. |
Activating and configuring the Webservice trace
You can configure the maximum size of the log and the number of backups, amongst others.
|
You must activate a Webservice log per Web Services Connector whereas you configure size and number for all Webservice logs. |
Refer to Logging SOAP Messages
Viewing / Storing the Webservice Trace
Select the log file in the combobox you want to view / save:
-
Click on the view icon to load the selected log file into the panel or use the context menu.
-
Click on the download icon or use the context menu to save selected log file as
*.log `or `*.txtfile.
You can also mark parts of the trace log and copy / save them using the context menu.
Refreshing the Webservice Trace
-
Click on the toolbar refresh icon to reload the log file displayed in the panel or use the context menu.
-
Click on the menu bar refresh icon to refresh combobox details or the list files. The content in the panel will not be refreshed.
Closing the Webservice Trace
Click on the close icon to close the log file displayed in the panel or use the context menu.
Searching the Webservice Trace
Use the context menu or refer to Tab-wise Search
Workbench Trace Log
Call up
INUBIT Workbench > Monitoring > Workbench Trace Log
When the Workbench Trace Log is activated, all logged actions and errors of the INUBIT Workbench can be displayed and stored here. All available log files are displayed in the combobox with the date and timestamp of that respective file.
Activating and configuring the Workbench Trace Log
You can configure the maximum size of the log and the number of backups.
Refer to Changing INUBIT Workbench Settings
Viewing / Storing the Workbench Trace Log
Select the log file in the combobox you want to view / save:
-
Click on the view icon to load the selected log file into the Workbench panel or use the context menu.
-
Click on the download icon or use the context menu to save selected log file as
*.log `or `*.txtfile.
You can also mark parts of the trace log and copy / save them using the context menu.
Refreshing the Workbench Trace Log
-
Click on the toolbar refresh icon to reload the log file displayed in the Workbench panel or use the context menu.
-
Click on the menu bar refresh icon to refresh combobox details or the list files. The content in the panel will not be
refreshed.
Closing the Workbench Trace Log
Click on the close icon to close the log file displayed in the panel or use the context menu.
Searching the Workbench Trace Log
Use the context menu or refer to Tab-wise Search
Error Messages in Monitoring
If monitoring is not available, an error message is displayed when clicking on the Monitoring tab. Possible causes are
-
a defective database from which monitoring is drawing display information,
-
a damaged database script.
Proceed as follows
-
Stop the server.
-
Do one of the following:
-
If you have got good SQL knowledge, configure the faulty entries in the database script
<SUITE-INSTALL-DIR>/inubit/server/ibis_root/log/db/logs.script. -
Rename the directory
<SUITE-INSTALL-DIR>/inubit/server/ibis_root/log/db, for instance, to<SUITE-INSTALL-DIR>/inubit/server/ibis_root/log/defective-db.
-
-
Start the server.
→ A directory db is created using a new, correct database script logs.script.
Monitoring is available again.
Remote Monitoring Using the Command Line Interface - StartCLI
The command line tool StartCLI opens a server shell for access to the remote INUBIT Process Engine. It is used to query the following information:
-
Version
-
Content of the Queue Manager (number of workflows with a certain status, internal queue size)
-
List of all users logged in
-
Uptime
-
Server time
-
Internal VM memory requirement
-
Alive check
-
Number of errors in workflows
-
Enable, disable, download trace
-
Send, display, delete messages (IS)
-
Available IPv4 addresses for the local host
Refer to System Monitoring Using CLI
Monitoring of Process Engine parameters using a REST call
|
A complete overview of the interfaces of the INUBIT REST API can be found here. |
Usage
To fetch information about the Process Engine, even if the Process Engine is currently in maintenance mode.
Prerequisites
You have a valid license including the feature name inubit Metrics.
Otherwise, an error message is displayed.
Proceed as follows
Open the following address using the host name or the IP address of your Process Engine and the port with which it can be reached in your web browser:
https://<server>:<port>/ibis/rest/metrics
With the additional format parameter, you can choose the format of the response.
When omitting the format parameter, the response is JSON formatted.
https://<server>:<port>/ibis/rest/metrics[?format={json|xml|prometheus}]
→ The following response in JSON format is returned when using the metrics REST call without the format parameter or with the format=json parameter.
|
A complete overview of the metric interfaces of the INUBTI REST API can be found here. |
The answer is similar to the following:
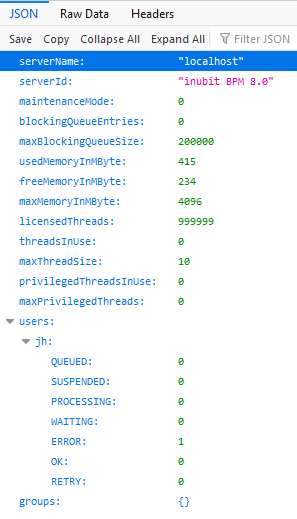
| Parameter | Description |
|---|---|
|
Server name |
|
Server ID |
|
Maintenance mode (0: off, 1: on) |
|
Number of entries in the blocking queue |
|
Maximum size of the blocking queue |
|
Used memory in MByte |
|
Free memory in MByte |
|
Maximum memory in MByte |
|
Number of licensed threads |
|
Number of used threads |
|
Maximum size of a thread |
|
Number of used privileged threads |
|
Maximum number of privileged threads |
|
Section with the number of processes in certain statuses for each user |
|
Section with the number of processes in certain statuses for each user group |
|
Number of processes in status OK |
|
Number of processes in status ERROR |
|
Number of processes in status PROCESSING |
|
Number of processes in status QUEUED |
|
Number of processes in status SUSPEND |
|
Number of processes in status WAITING |
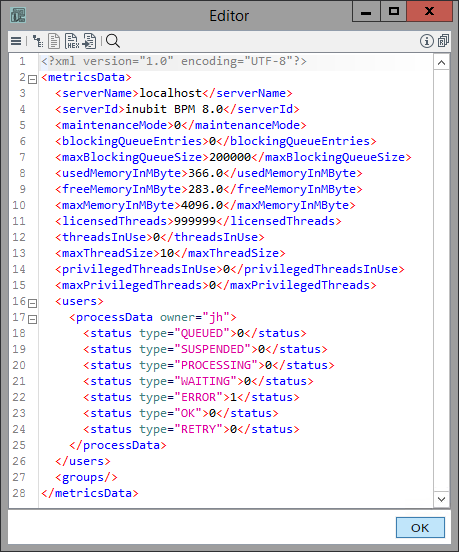
When adding the format=xml parameter, the response is formatted as follows:
When adding the format=prometheus parameter, the response is formatted as follows:
is_memory_free_megabytes{server="localhost",server_id="INUBIT 8.0"} 193
is_memory_max_megabytes{server="localhost",server_id="INUBIT 8.0"} 4096
is_memory_used_megabytes{server="localhost",server_id="INUBIT 8.0"} 456
is_threads_licensed{server="localhost",server_id="INUBIT 8.0"} 999999
is_threads_total{server="localhost",server_id="INUBIT 8.0"} 0
is_threads_max{server="localhost",server_id="INUBIT 8.0"} 10
is_threads_privileged_total{server="localhost",server_id="INUBIT 8.0"} 0
is_threads_privileged_max{server="localhost",server_id="INUBIT 8.0"} 0
is_blockingqueue_total{server="localhost",server_id="INUBIT 8.0"} 0
is_blockingqueue_max{server="localhost",server_id="INUBIT 8.0"} 200000
is_maintenancemode{server="localhost",server_id="INUBIT 8.0"} 0
is_process_total{status="QUEUED",owner="jh",server="localhost",server_id="INUBIT 8.0"} 0
is_process_total{status="SUSPENDED",owner="jh",server="localhost",server_id="INUBIT 8.0"} 0
is_process_total{status="PROCESSING",owner="jh",server="localhost",server_id="INUBIT 8.0"} 0
is_process_total{status="WAITING",owner="jh",server="localhost",server_id="INUBIT 8.0"} 0
is_process_total{status="ERROR",owner="jh",server="localhost",server_id="INUBIT 8.0"} 1
is_process_total{status="OK",owner="jh",server="localhost",server_id="INUBIT 8.0"} 0
is_process_total{status="RETRY",owner="jh",server="localhost",server_id="INUBIT 8.0"} 0
Changing the Monitoring Table Views
The number of table entries displayed in the various monitoring tabs can become very large. Various options are thus provided to customize the table display. These are described in the following sections.
Navigating in Monitoring Tables
The navigation tools are located on the right, above the monitoring tables.
-

Row number of currently selected row/Number of rows visible. If you enter a row number and press Enter, the specified row is displayed and highlighted.
-

Displays the first or last row of the table. Useful for jumping quickly to the start or end of large tables.
Sorting
You can sort the contents of the monitoring tables.
Simple Sorting
Proceed as follows
-
Click the header of the column on which you want to sort the table.
-
The table is sorted. An up arrow in the column header indicates that the table was sorted in ascending order on the selected column.
Reversing/Canceling the Sort
Proceed as follows
-
Click the column header again; the up arrow in the table header indicates that the sort has been reversed.
-
If you now click again, the sort is canceled. No arrow is now displayed in the table header. Alternatively, click in the View field on the empty line.
Filtering the Table Contents
You can filter the contents of the monitoring tables on one or more criteria. Only the rows that match the specified filter criteria are then displayed. All other rows are hidden.
Filtering
Proceed as follows
-
Click in the yellow row below the column header you want to use as the criterion for filtering the table contents. A dialog is displayed.
All the various entries in that column are displayed. Select the checkboxes for the entries that are to serve as filter criteria. These entries continue to be displayed while all others are hidden.
Alternatively, enter the filter criterion (or a part thereof) directly in the text input field above the list. This is useful if all the entries you want displayed contain a common (partial) character string.
-
Click OK.
The table contents are filtered in accordance with your specification; in the example shown, entering the partial character string System would cause just the entries System-Connection and System-Start to be displayed.
The filter criterion is displayed in the yellow cell at the head of the filtered column as long as the filter is active.
Displaying All
Proceed as follows
To cancel the filter on a column, open the dialog for the column then click All.
The column filter is removed. If no further filters are defined, the full contents of the table are now displayed; the label All is displayed in the yellow cell. If there are further filters defined, the contents of the table that match the remaining filters are now displayed.
Showing/Hiding Columns
To improve readability of the monitoring tables you can selectively hide and reveal individual columns.
Proceed as follows
-
Open the context menu for a table header. The following menu is displayed containing all the available columns.
-
To hide a column, delete the check mark from the corresponding checkbox.
-
To show a column, select its checkbox.
Saving, Displaying and Deleting Table Views
You can save all the changes that you have made to monitoring tables in the Queue Manager, Scheduler Manager, Connection Manager oder Key Manager as named table views.You can store as many views as you like.
The views are stored in the directory <Operation_system_specific_user_directory>/inubit/Toolset/<Version>/conf/view.
Storing Table Views
Proceed as follows
-
Configure the table as desired.
-
In the field View, enter a name for the view.
The view name must not contain an underscore "_".
-
Click
 to save the view.
|
For the Process Log only: The stored view file contains the attribute |
Displaying Table Views
Proceed as follows
Select an entry from the drop-down list of the field View.
