Application Examples
Filtering by Process
Users can use multiple configurations to filter which Diagrams should be loaded.
Filtering Processes by Diagram Type
By default, all Diagram types are displayed:
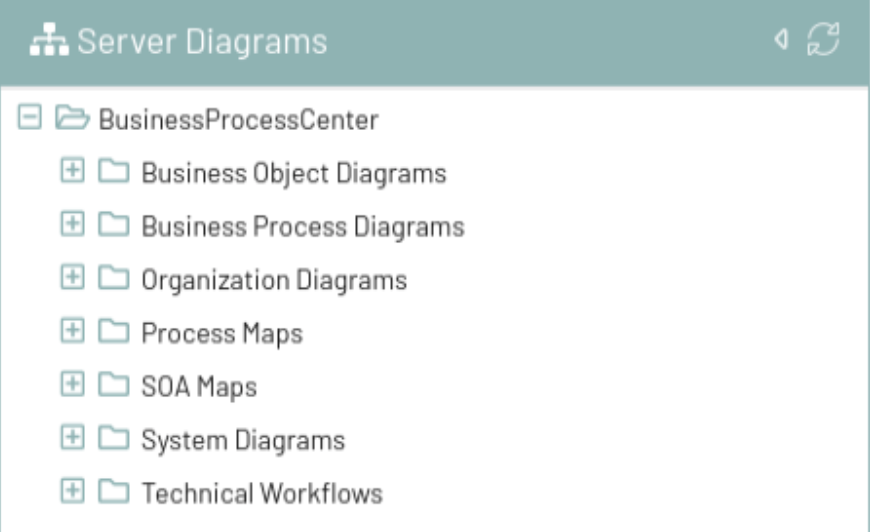
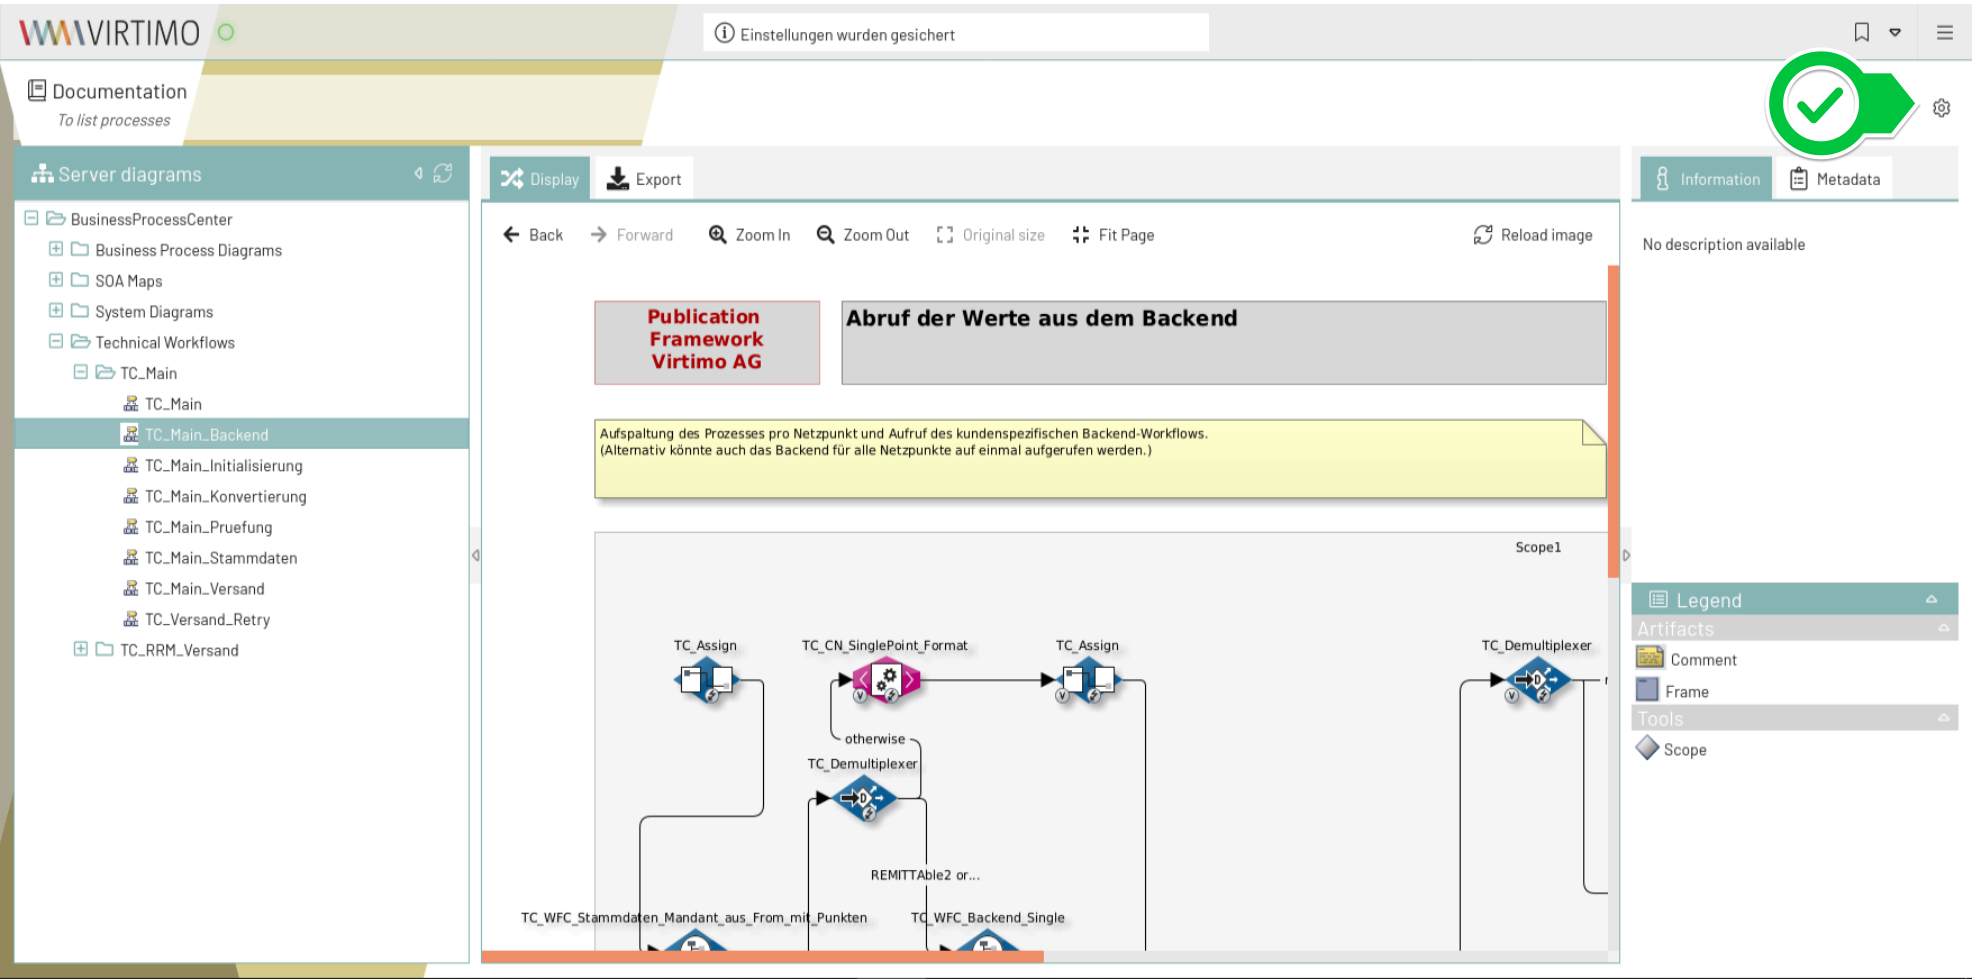
The visible diagram types can be restricted as follows:
-
Navigate to the module settings
-
Configure the "displayedDiagramTypes" property. You can enter the various diagram type keys, separated by commas.
-
The following values are allowed:
| Diagram Type | Configuration Value |
|---|---|
Business Object Diagrams |
|
Business Process Diagrams |
|
Organization Diagrams |
|
Process Maps |
|
SOA Maps |
|
System Diagrams |
|
Technical Workflows |
|
-
An empty "displayedDiagramTypes" means that no filtering takes place and all diagrams with a matching process role are displayed.
Filtering processes by user group
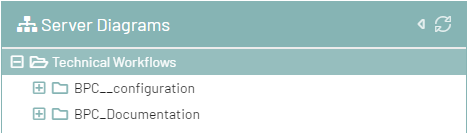
By default, diagrams for all users or user groups are displayed:
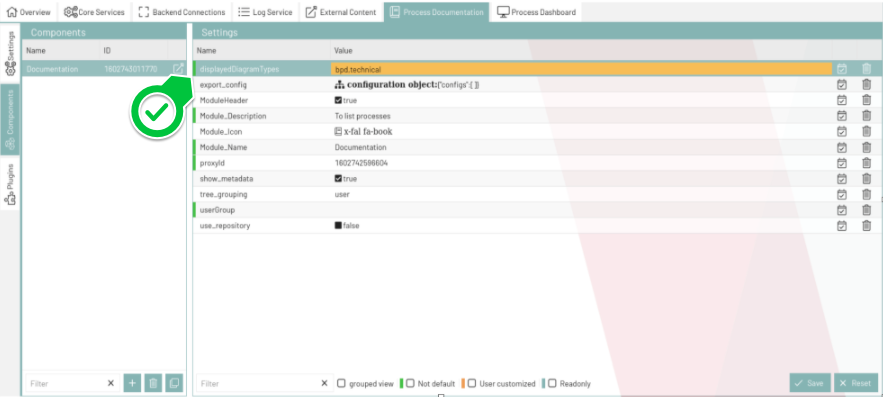
The visible diagrams can be filtered as follows:
-
Navigate to the module settings
-
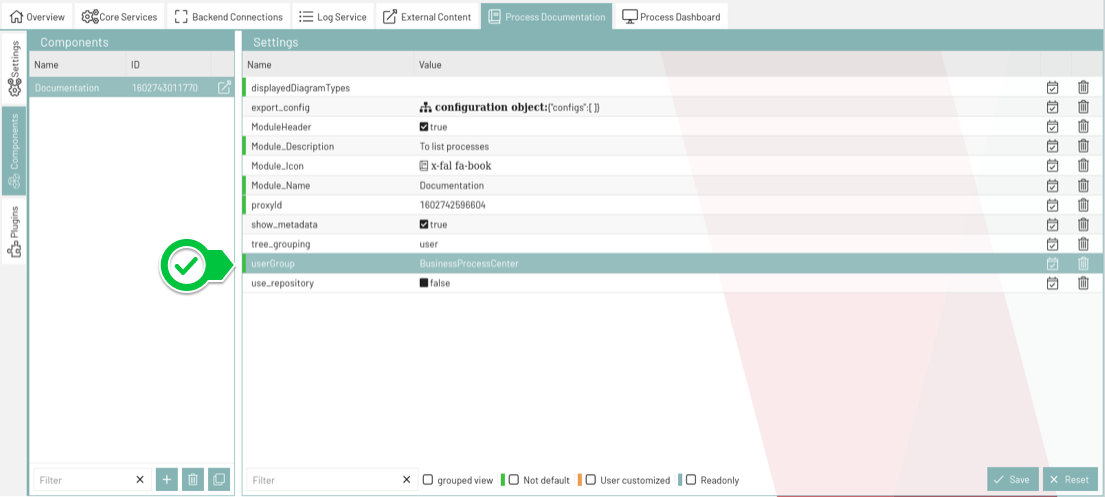
Enter the name of the INUBIT user group in the "userGroup" property
-
For example, if you want to see only diagrams from the "BusinessProcessCenter" user group, configure userGroup as follows:
-
An empty “userGroup” means that no filtering takes place and all Diagrams with a matching process role are displayed.
Opening Linked Diagrams
Links between diagrams can be followed in the BPC Process Documentation module. Clicking the link opens the target diagram directly.
To view module information for a diagram element:
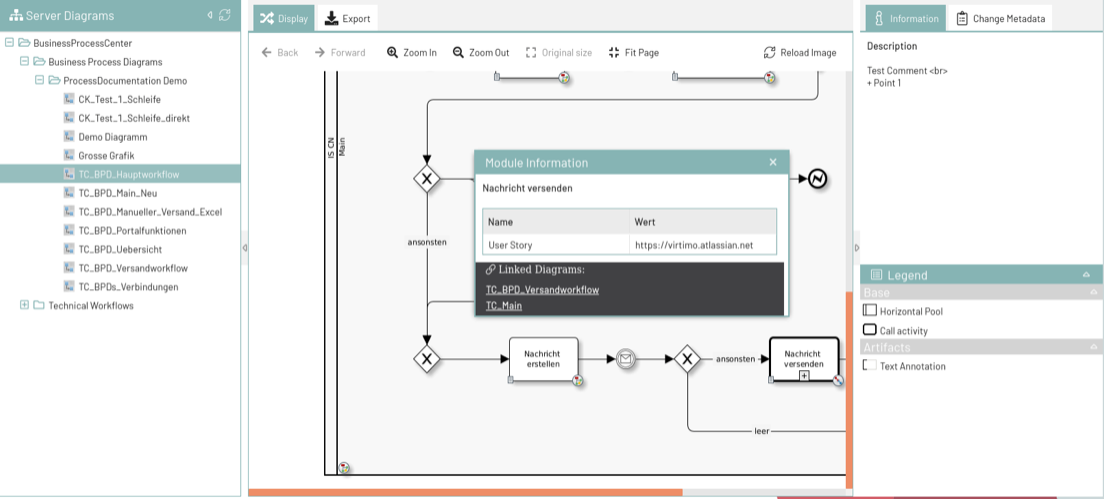
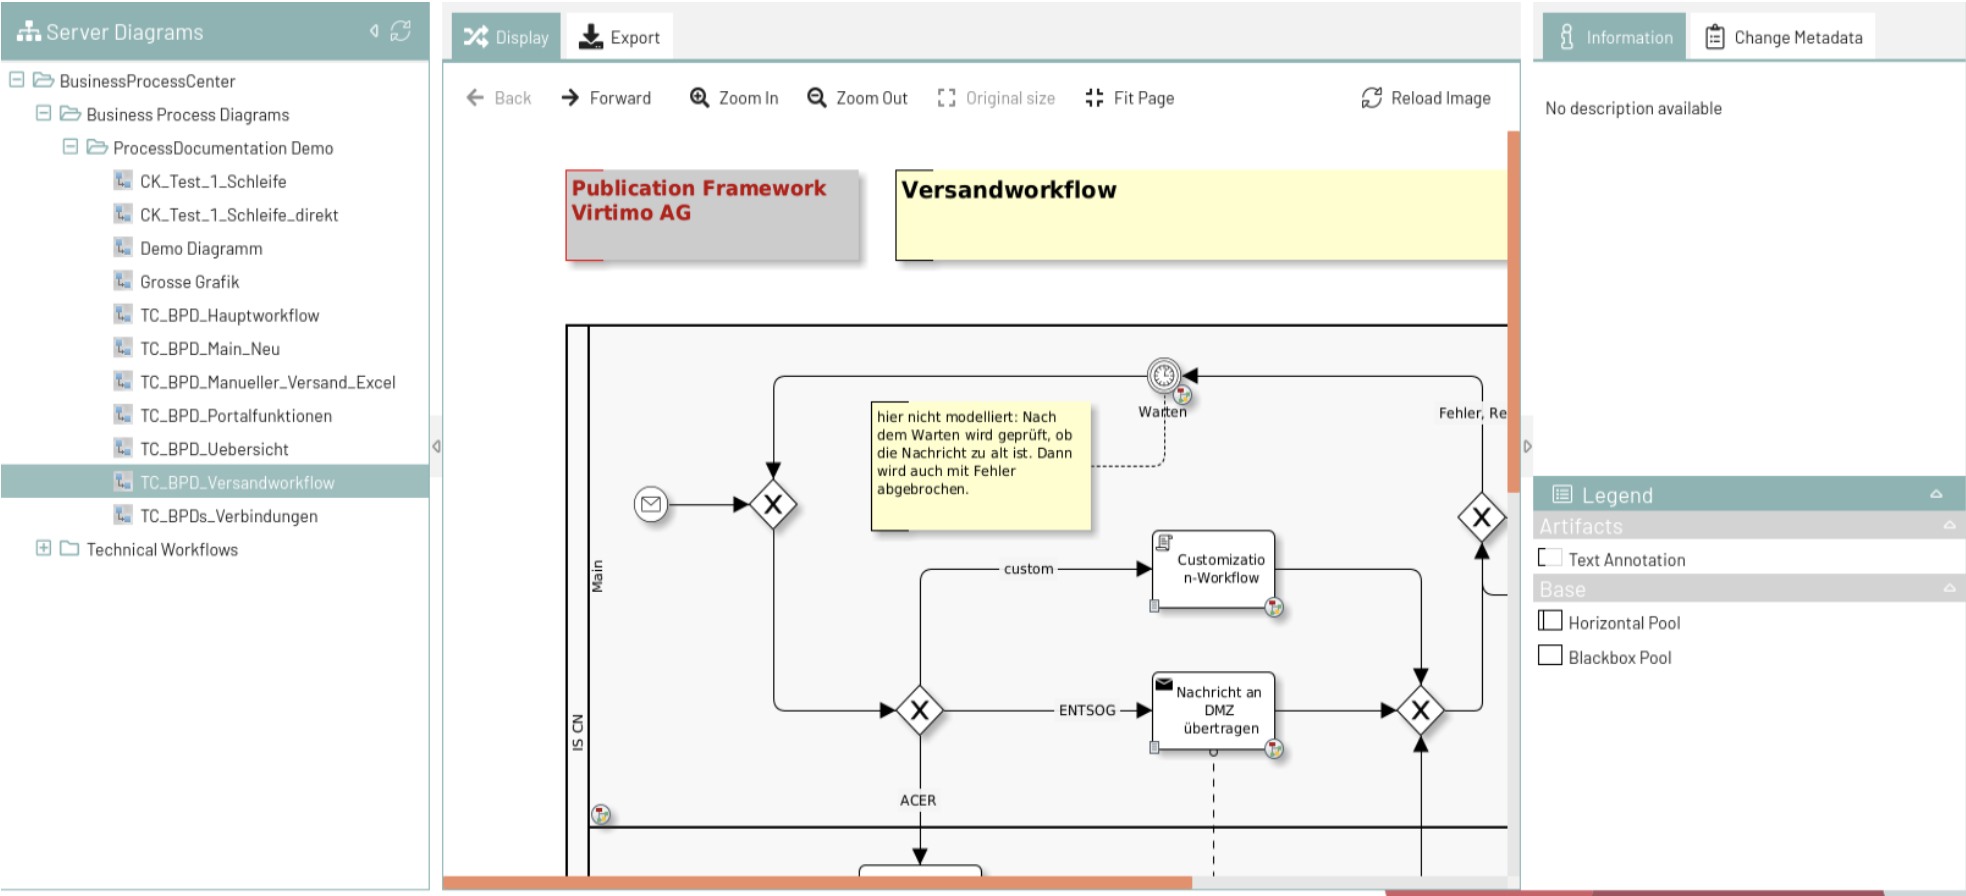
Then click on one of the links displayed in the module information dialog:
|
Alternatively
Switch to the "Metadata" tab. There you will find a list of all linked diagrams for the currently visible diagram. Here, you can follow the links in the same way as described above. |
Using Metadata and Legends
Metadata that users have linked to Diagrams or their elements in INUBIT can be displayed in the BPC Process Documentation module.
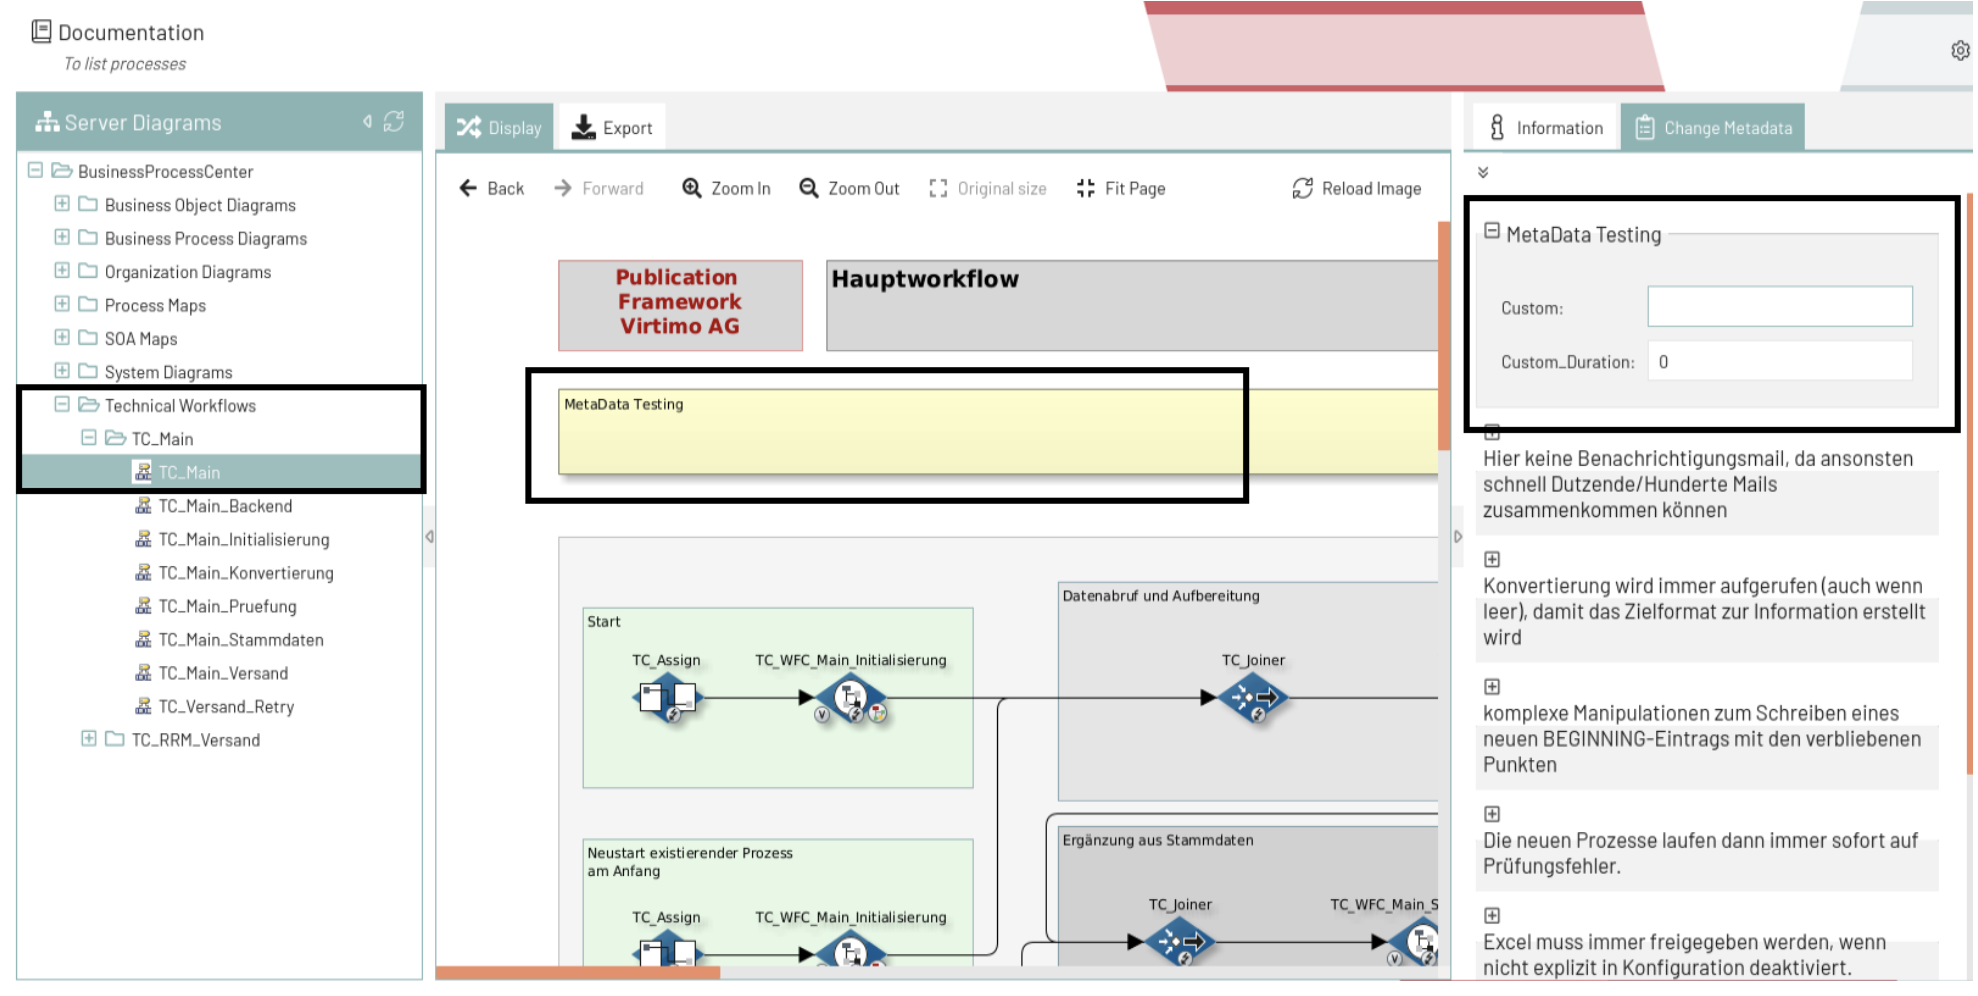
View a diagram and switch to the "Information" or "Metadata" tab.
|
Alternatively
Click on the diagram element whose metadata you want to view. If a comment has been entered for the element, it will also be displayed. |
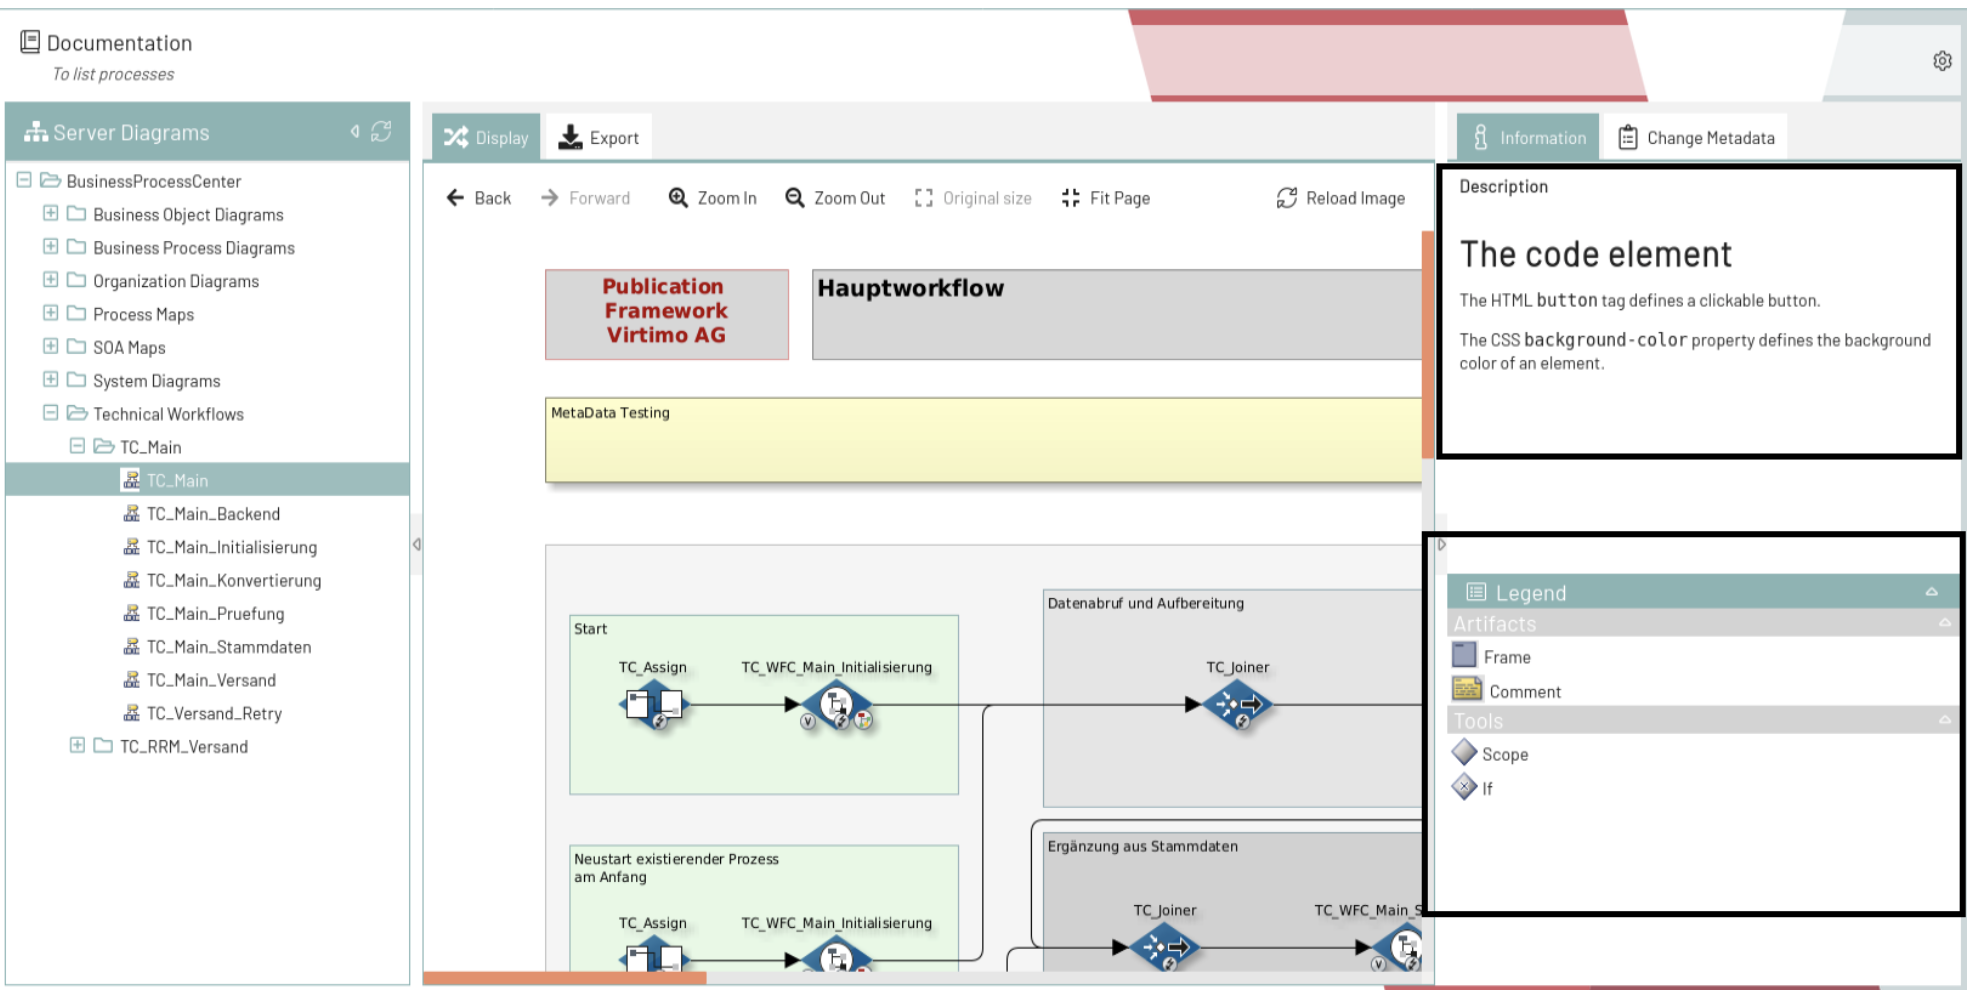
The description of the Diagram is displayed in the upper section. If no description text has been entered, a corresponding message is displayed.
The lower section contains the Diagram’s legend. This clearly displays all elements used in the Diagram.
Exporting Process Information
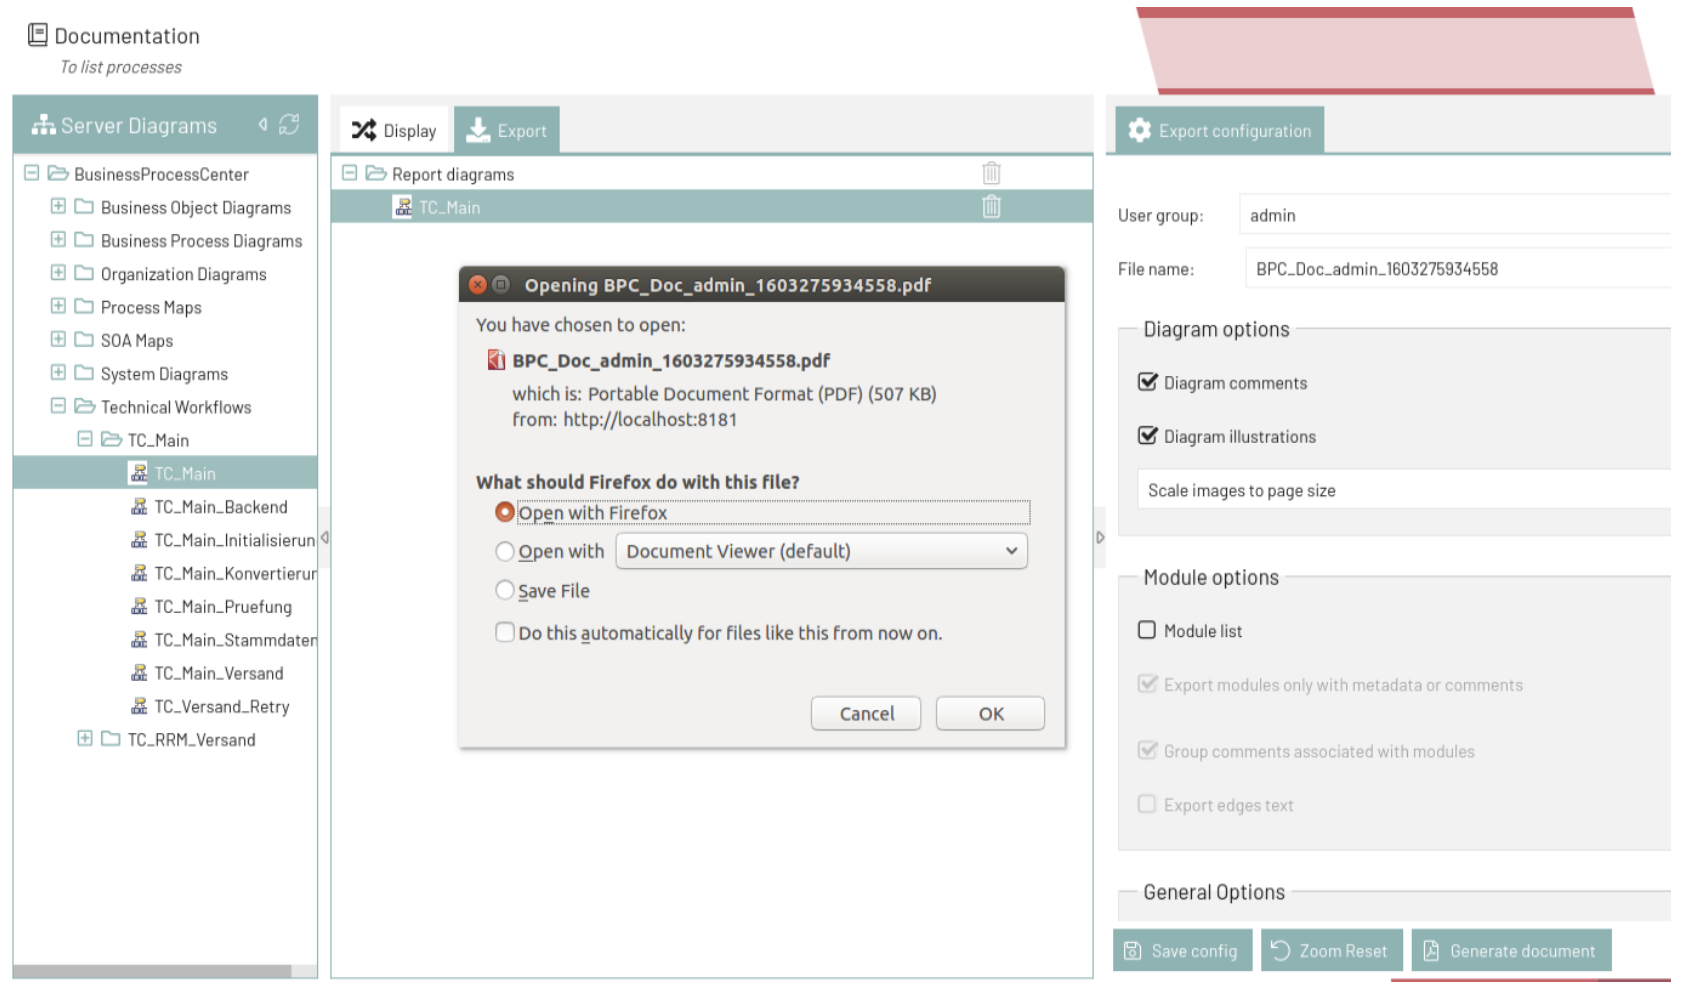
You can export Diagrams and information/metadata as a PDF.
|
Prerequisites
The file The workflow |
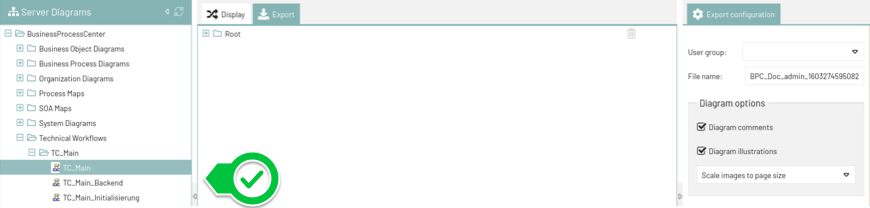
Switch to the Export tab and drag all relevant Diagrams from the tree into the Export tab (drag-and-drop):
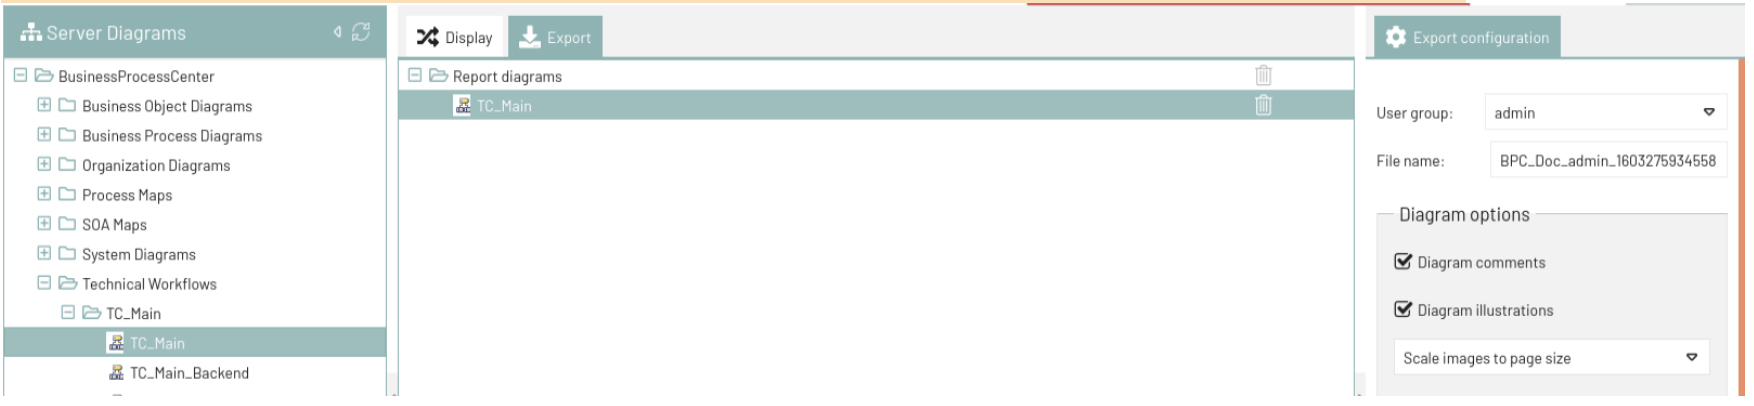
You can then set the order of the Diagrams in the PDF. To do this, drag the Diagrams up or down in the Export tab (drag-and-drop).
Clicking "Generate Document" starts the creation of the PDF file. Once it has been successfully generated, it can be opened in the browser or downloaded.