Data Analysis
|
The Analysis module requires a separate license and is not included in the standard BPC package. |
The Analysis module is designed to retrieve data from a wide variety of sources and visualize it in the desired format. After selecting and configuring the data source, the data can be modified as needed.
The processed data is then passed to the Charting Library amCharts4 . Now the individual visualizations (charts) can be created. Various chart types are available, as well as tables or an HTML template. Optionally, the appearance of the charts can be customized using predefined user interfaces or custom JSON parameters.
Individual charts can be configured directly as widgets and used in a BPC dashboard. Any number of charts can also be combined into reports with customizable layouts.
Reports can be visualized in a dashboard in the same way as charts.
If a specific structure and categorization are desired, reports can be loaded into a tree structure (catalog).
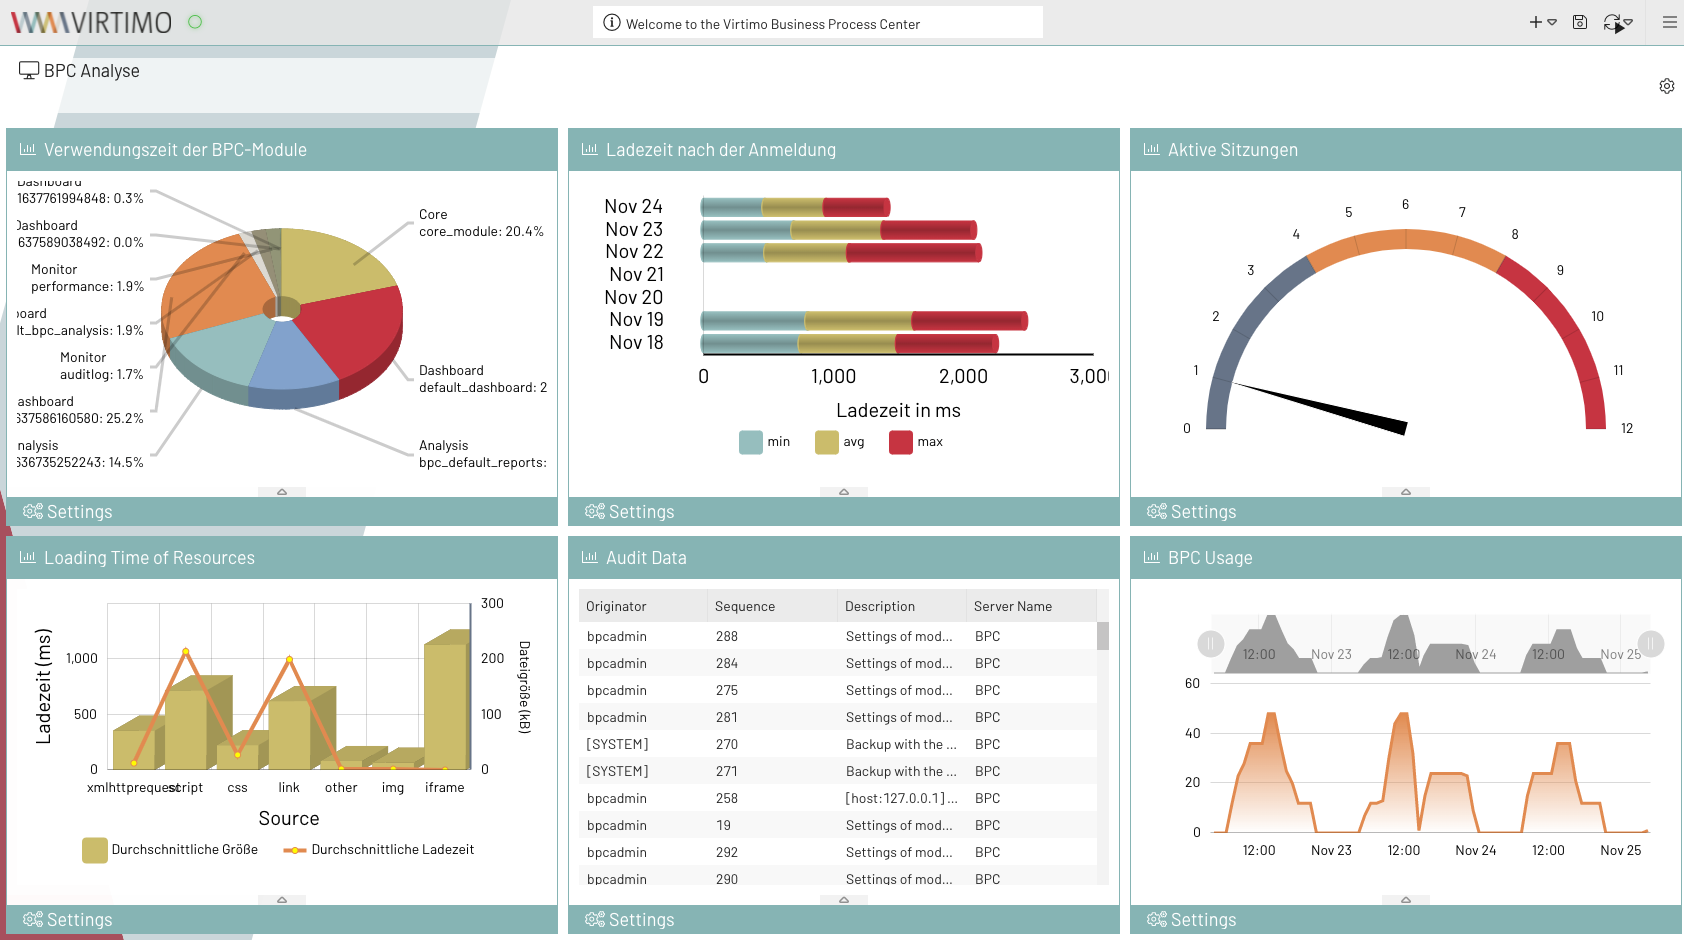
Ready-made datasets and charts containing performance data from the BPC application are already available for the BPC.
These can be used as illustrative examples of how the Analysis module works.
Features
-
Prepare data from various sources and visualize it in reports
-
Further processing of the retrieved data through custom scripting (Groovy or JavaScript)
-
Pie, bar, line, and speedometer diagrams, as well as tables and HTML templates for visualizing the data
User Groups
-
Producers
This user group is responsible for creating datasets, diagrams, and reports.
Producers need an understanding of data structures (especially in JSON format) to configure the charts based on the provided datasets. -
Consumers
This user group consumes the provided reports and can therefore only view them in the catalog.
If the administrator has granted the necessary permissions, changes can also be made to the catalog’s tree structure.
