Dataset Editor
The Dataset Editor is the starting point of the Analysis module. This editor allows you to provide data for the charts. During configuration, you can select different data sources and add variables.
Data is modified using separate sequential blocks (modifiers) that can be chained together. This allows you to tailor the dataset as closely as possible to the desired end result. At the same time, even with complex processes, you can maintain an overview of the individual scripts.
The most important steps when creating and editing a dataset are:
Create/Edit/Delete Datasets
In this section, you can add new datasets or edit or delete existing ones.
The datasets are automatically grouped by data source.
| Button/Icon | Description | Function |
|---|---|---|
|
Add |
Creates a new record |
Duplicate |
Copies the selected record, including all configurations, and adds the copy to the end of the list or the end of the group |
|
Delete |
Removes the selected record |
|
Open group |
Displays all entries associated with this data source type |
|
Close group |
Minimizes all entries associated with this data source type |

Sort Record Entries
It is possible to sort both grouped and ungrouped record entries in ascending or descending order.
For grouped entries, sorting is performed within each individual group.
For ungrouped entries, all entries are sorted accordingly.
The parameters used for sorting are the columns (see Showing and hiding columns.
Configuring Records
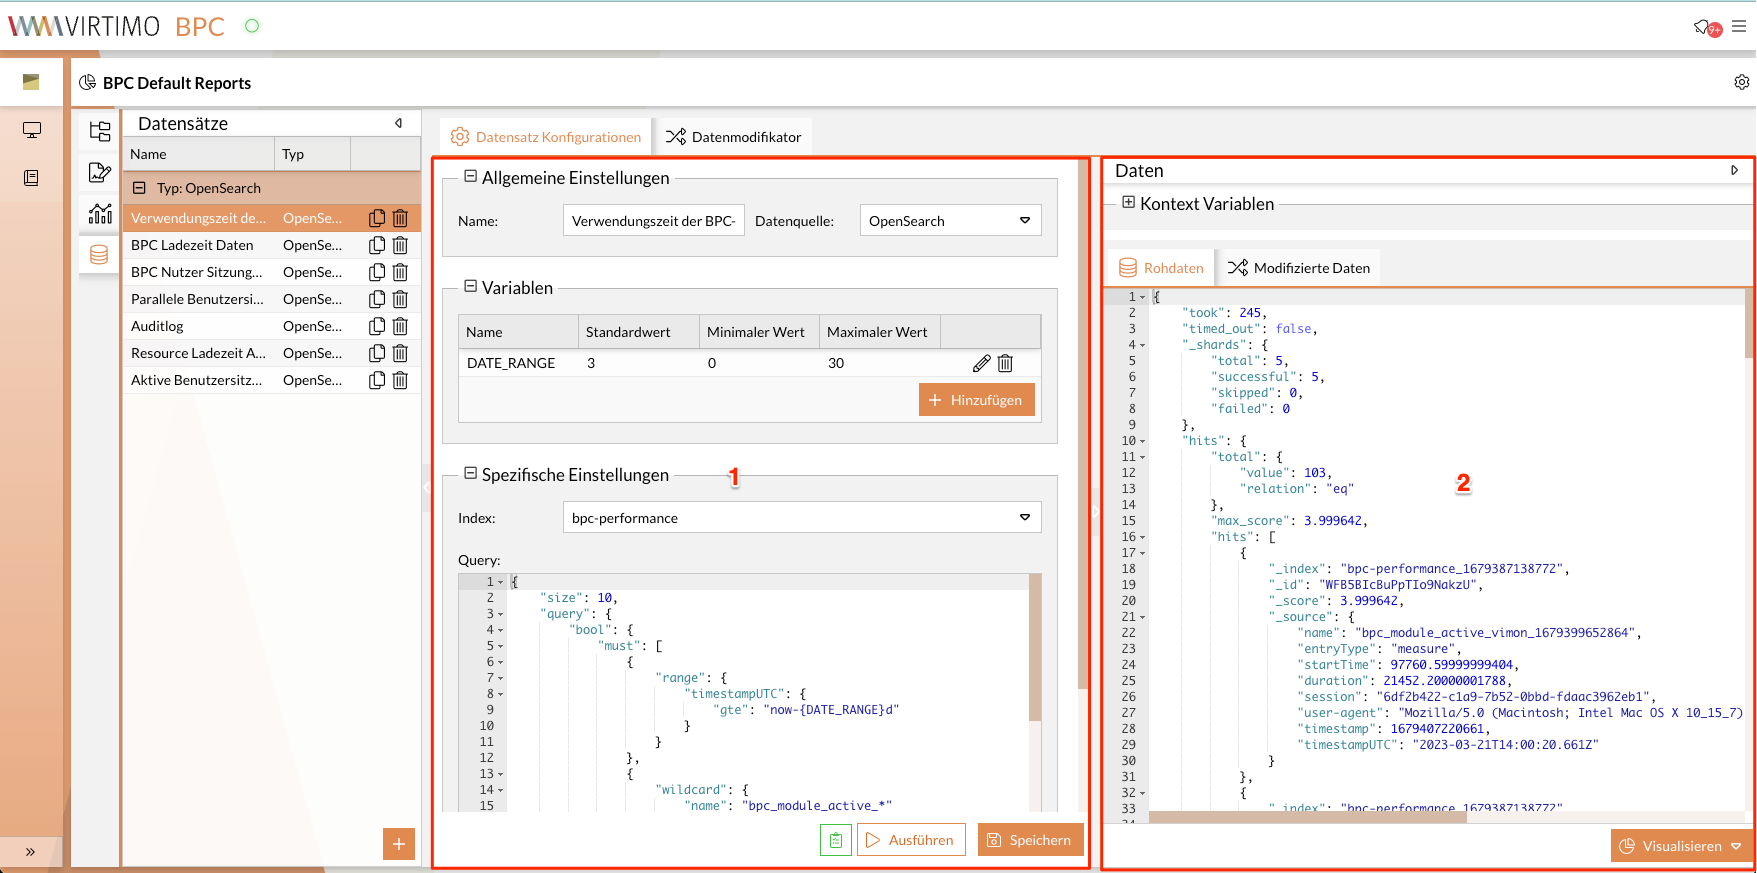
The view is divided into the following sections:
-
Section 1: Configurations
-
Section 2: Preview
Configurations
The configurations consist of three different subsections where settings can be adjusted:
The button indicates whether all entered data and Parameters are valid and permitted.
If there are invalid entries, the button turns orange.
When you hover over it with the mouse pointer, the missing or invalid entries are also displayed.
General Settings
This group contains basic configurations for a data record.
- Name
-
The name of the data record.
Valid entries include all letters from a-z, numbers from 0-9, and special characters. - Data Source
-
The source from which the data is retrieved.
The selection is made from the drop-down list.
Depending on the data source, specific configurations must be set (see also Specific Settings).
The following sources are currently supported:
-
OpenSearch: Data from the OpenSearch instance that serves as the BPC’s database
-
JSON: Static dataset used for demonstration purposes
-
HTTP: JSON data from an external source retrieved via a URL
-
INUBIT: reports generated in INUBIT regarding its own performance (report data)
The default data source when adding a new dataset is the OpenSearch instance that comes with the BPC.
Variables
Variables represent dynamic parameters when querying the data source.
For example, you can narrow down the time periods to which the data refers.
The variables can be configured when visualizing the charts and, optionally, made available to the user in reports.
You can then adjust the variable(s) as needed.
|
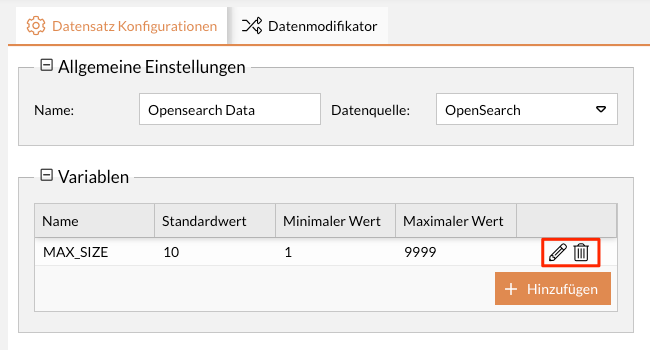
Currently, variables are only supported for OpenSearch as a data source. |
A variable must be assigned at least a name. Furthermore, the variable must be assigned a type. Currently, 5 variable types are available: Text, Boolean, Number, List, and Date. The variable types and configuration options are shown in the following table.
| Type | Possible Configuration | Description | Example |
|---|---|---|---|
text |
Default Value |
If no value is set in a specific context, this value is used. |
"Testvariable" |
boolean |
Default value |
If no value is set in the specific context, this value is used. |
Checkbox with a checkmark (true) or |
number |
Default value |
If no value is set in the specific context, this value is used. |
"10" |
Value range |
Only values within this range are valid. |
Min: "1", |
|
list |
Value list |
Values offered for selection in the chart/report. |
"1,2,3,4,5" |
Default value |
A value from the value list. |
"3" |
|
date |
Date format |
Date values are converted to this format before being sent to the data source. |
"Y-m-d" |
Default value |
If no value is set in this specific context, this value is used. |
"22.02.2022" |
|
Value range |
Only values within this range are valid. |
Min: "01.01.2022", |
Specific Settings
These are special settings for a specific type of data source.
[#data_source]The following table provides an overview of the specific configuration options for each data source:
| Data Source | Specific Setting | Description | Example |
|---|---|---|---|
OpenSearch |
Index |
Name of the OpenSearch index containing the desired data. |
"BPC-auditlog" |
Query |
OpenSearch query in JSON format; see also the official OpenSearch documentation. In this query, you can use the configured Variables. For storage reasons, the result data does not contain fields with binary data. |
|
|
JSON |
JSON Data |
static dataset in JSON format (typically object or array). |
|
HTTP |
URL |
External URL from which JSON data is retrieved. |
|
INUBIT |
INUBIT Connection |
A connection (type: http_proxy) to an INUBIT server that has been preconfigured in Backend Connections. |
Selection from the drop-down list; |
Report ID |
ID of a report that was configured in INUBIT. |
Select from the drop-down list |
Data Preview
After the configuration is complete and the dataset has been executed and saved, a preview of the data is displayed. In this preview, you can also set or adjust a context variable that was created in the configurator; see Variables. Using the context variable, you can test how the data behaves in response to changes in the values of this variable.
Modifying the Data
After retrieving and configuring the data, it may not yet be in the correct format for generating charts. Depending on the desired chart type, the data should be formatted accordingly. This task is handled during the modification of the dataset.
A modifier is a code snippet that manipulates input data.
The code snippet is typically executed on the backend, and the result is sent back to the frontend.
Modifiers are executed in sandbox mode.
This means that modifiers do not have access to critical resources (e.g., file system, network, etc.).
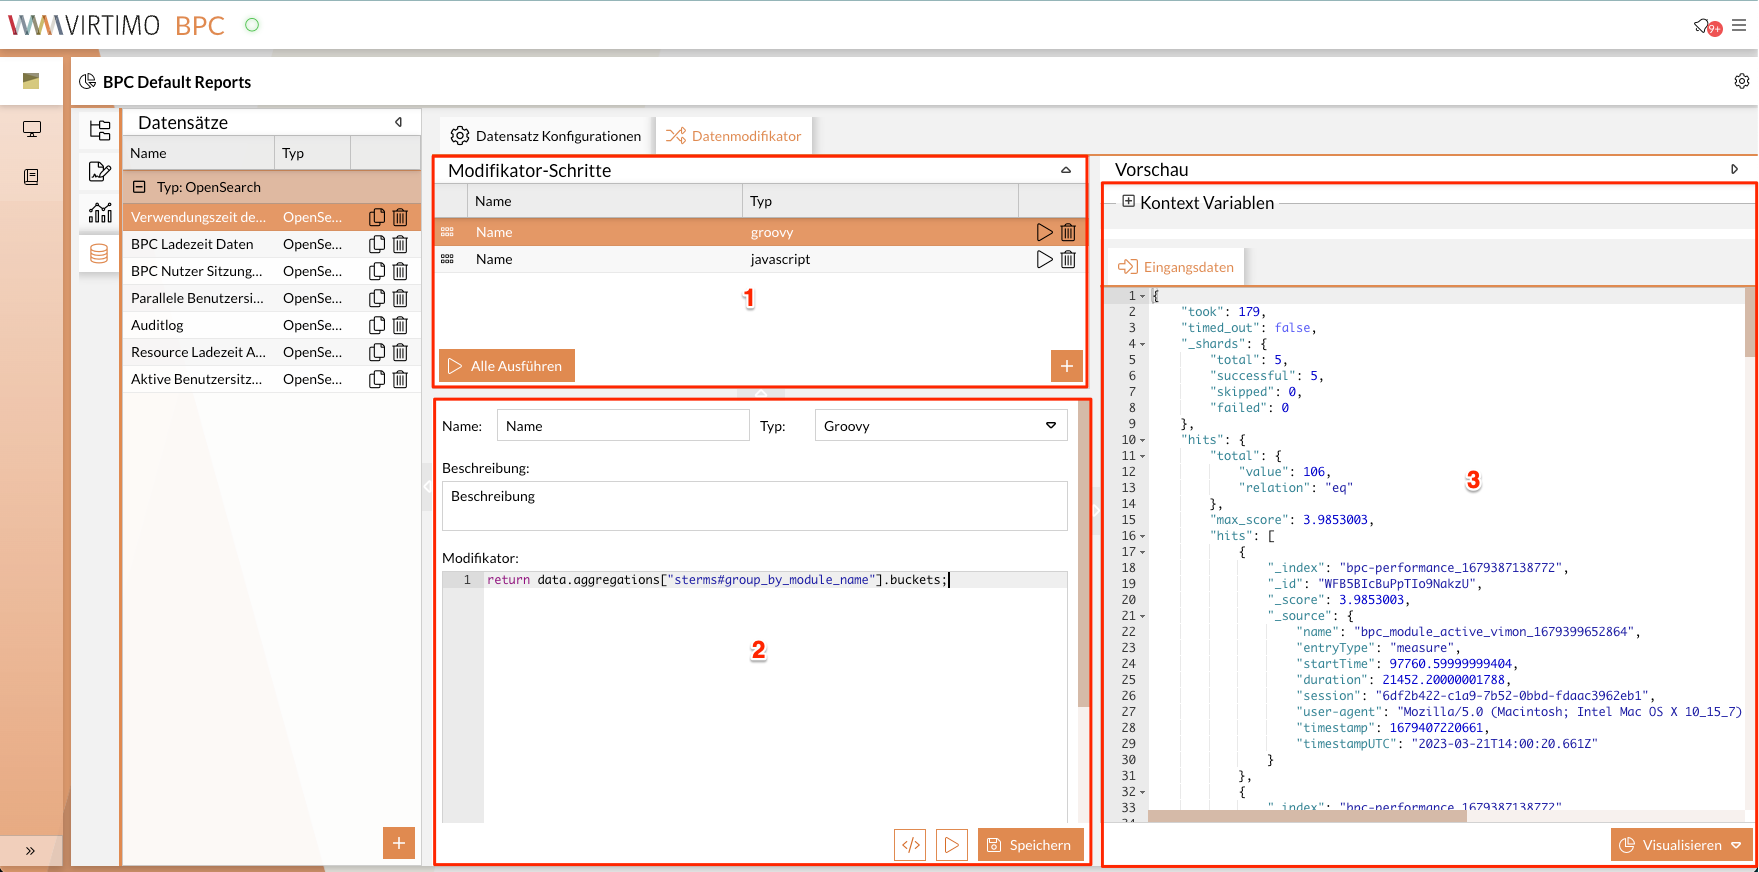
The view is divided into the following sections:
-
Section 1: Modifier Steps
-
Section 2: Configuration
-
Section 3: Preview
Modifier Steps
This section lists all the individual modification steps that have been created.
Here you can create, delete, or execute a modifier, or execute all modifiers.
The order of the modifier steps can be changed via drag-and-drop.
| Icon/Button | Description | Function |
|---|---|---|
|
Add |
Creates a new modifier step |
Execute up to this step |
Executes all previous (upstream) modifier steps, including the selected step. |
|
Delete |
Removes the selected modifier step |
|
|
Execute All |
Executes all existing modifier steps sequentially (from top to bottom). |

Configuration
This section contains basic configurations for a modifier.
- Name
-
The name of the modifier.
- Type
-
Type of the modifier.
The following types are currently supported:-
JavaScript: Data from the OpenSearch instance that serves as the BPC’s database
-
Groovy: Static dataset used for demonstration purposes
-
The default type when adding a new modifier is Groovy.
- Description
-
Additional information about the modifier.
- Modifier
-
Modification rules as source code.
Depending on the type, either JavaScript code or Groovy code must be used.
JavaScript Modifier Type
With this type, a modifier is defined as JavaScript source code.
The entry point for this modifier is the method: modify(data, vars).
This can also be understood as a main method.
The return value of this method provides the input data for the next modifier step or for a chart.
The method has two parameters:
- data
-
Input data.
Input data is usually the result of the last modifier. If the current modifier is the first one, the raw data of the current data set is used. - vars
-
When accessing this object, you have access to the values of the data setVariables that were created during data set configuration.
function modify (data, vars) {
   const result = helper(data);
   return result;
}

function helper (data) {
   return data;
}
Groovy Modifier Type
Only the following libraries are integrated for Groovy execution:
groovy (groovy-core), groovy-datetime, groovy-json
With this type, a modifier is defined as Groovy source code.
Unlike the JavaScript modifier, there is no entry method here.
Modifier rules can be defined directly in the code block.
The return value of this method provides the input data for the next modifier step or for a chart.
In this code section, two objects are provided:
- data
-
input data.
Input data is typically the result of the last modifier. If the current modifier is the first one, the raw data of the current dataset is used. - vars
-
When accessing this object, you have access to the values of the datasetVariables that were created during dataset configuration.
data.collect { el -> return el * el }
return data
Application Examples
The following examples create and configure datasets that originate from different data sources. In addition, two different modifier types are configured.
Create and Configure a Dataset
-
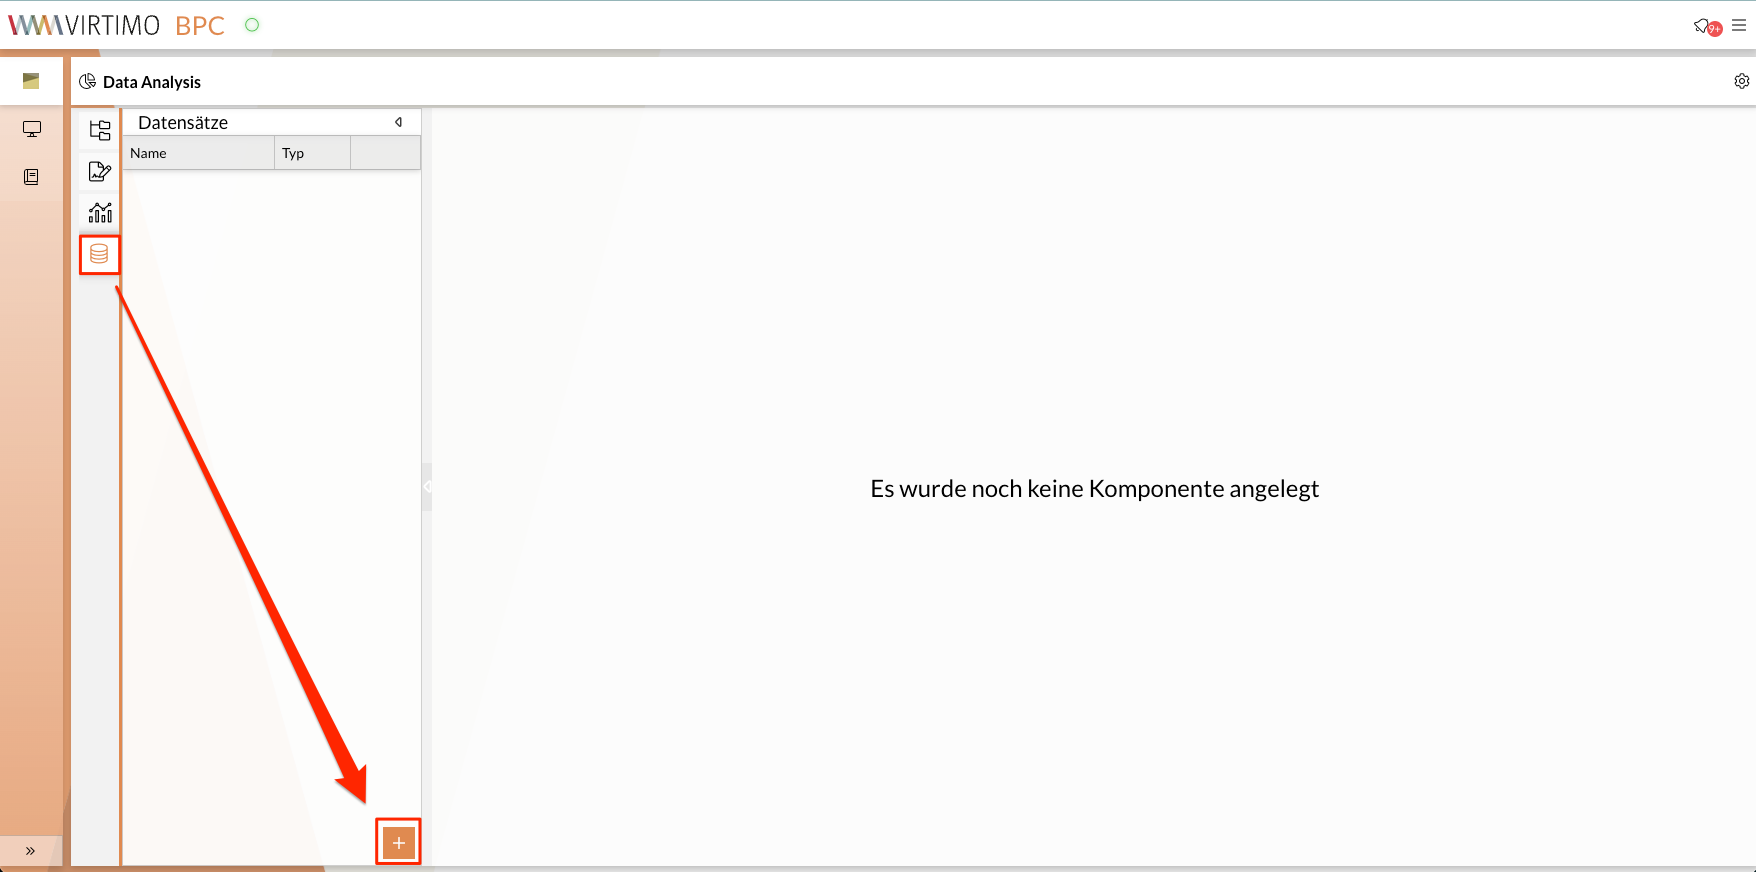
In the Analysis module, select the Dataset Editor.
-
Add a new dataset.
-
Enter a name.
-
Select "OpenSearch" as the data source.
-
Enter a description if desired.
-
Select "Index."
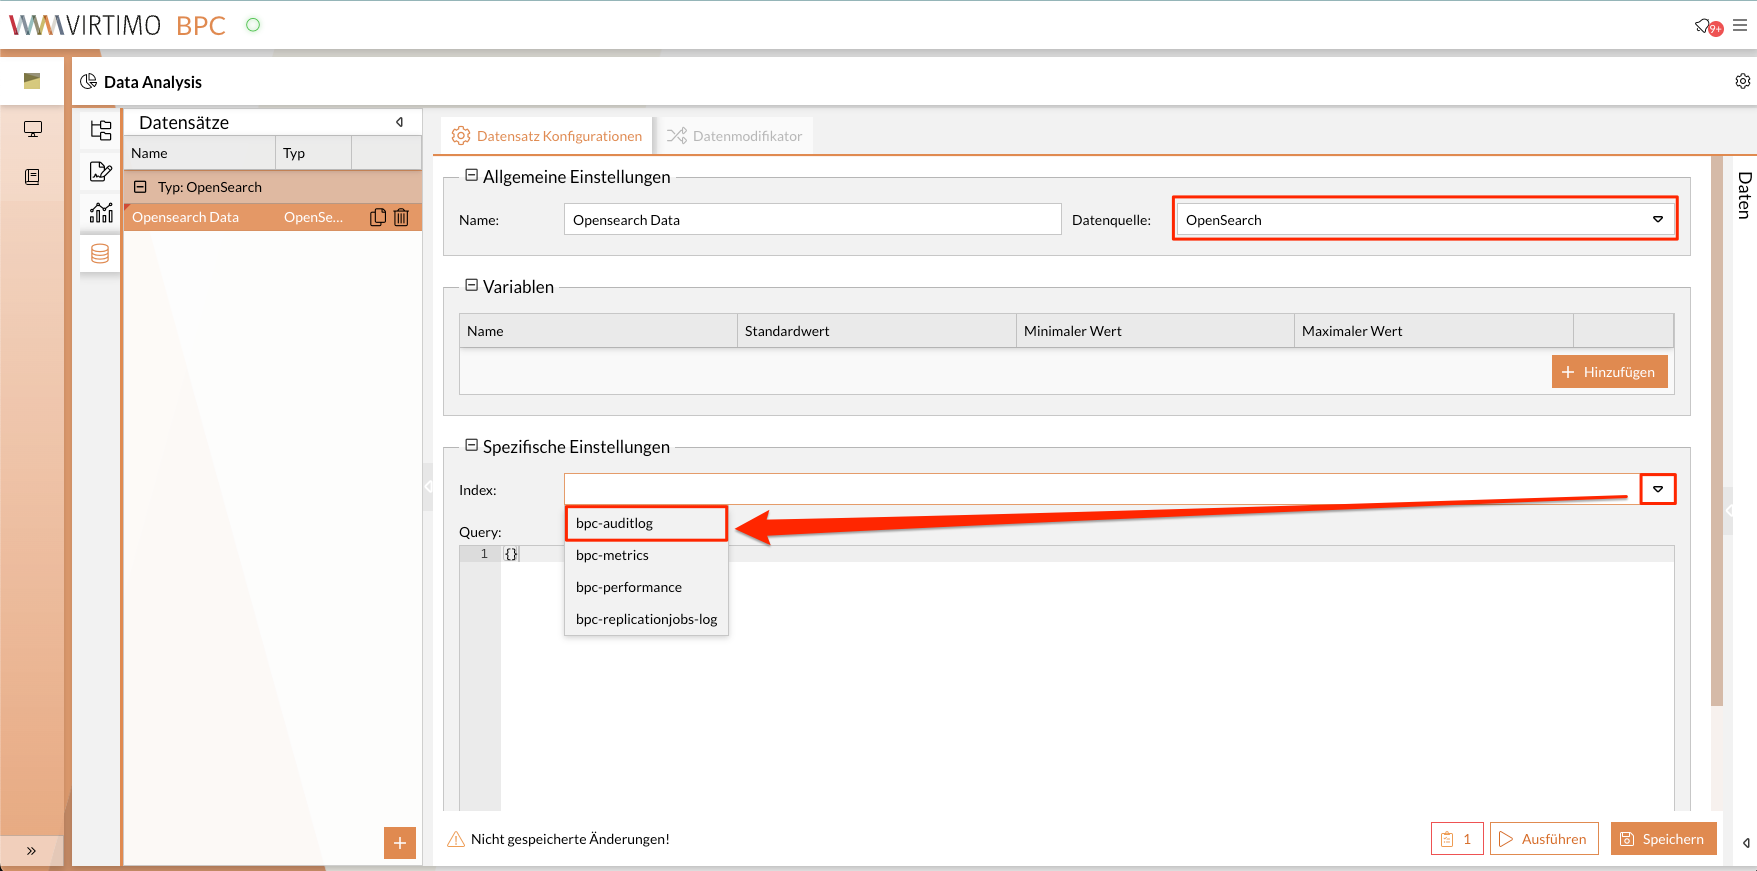
-
Enter a query.
-
Add variable(s) if necessary.
-
In the Variables section, click the Add button.
-
Enter the variable name.
-
Select the variable type (see Variables).
-
Enter default values if necessary
-
Enter minimum and maximum values if necessary.
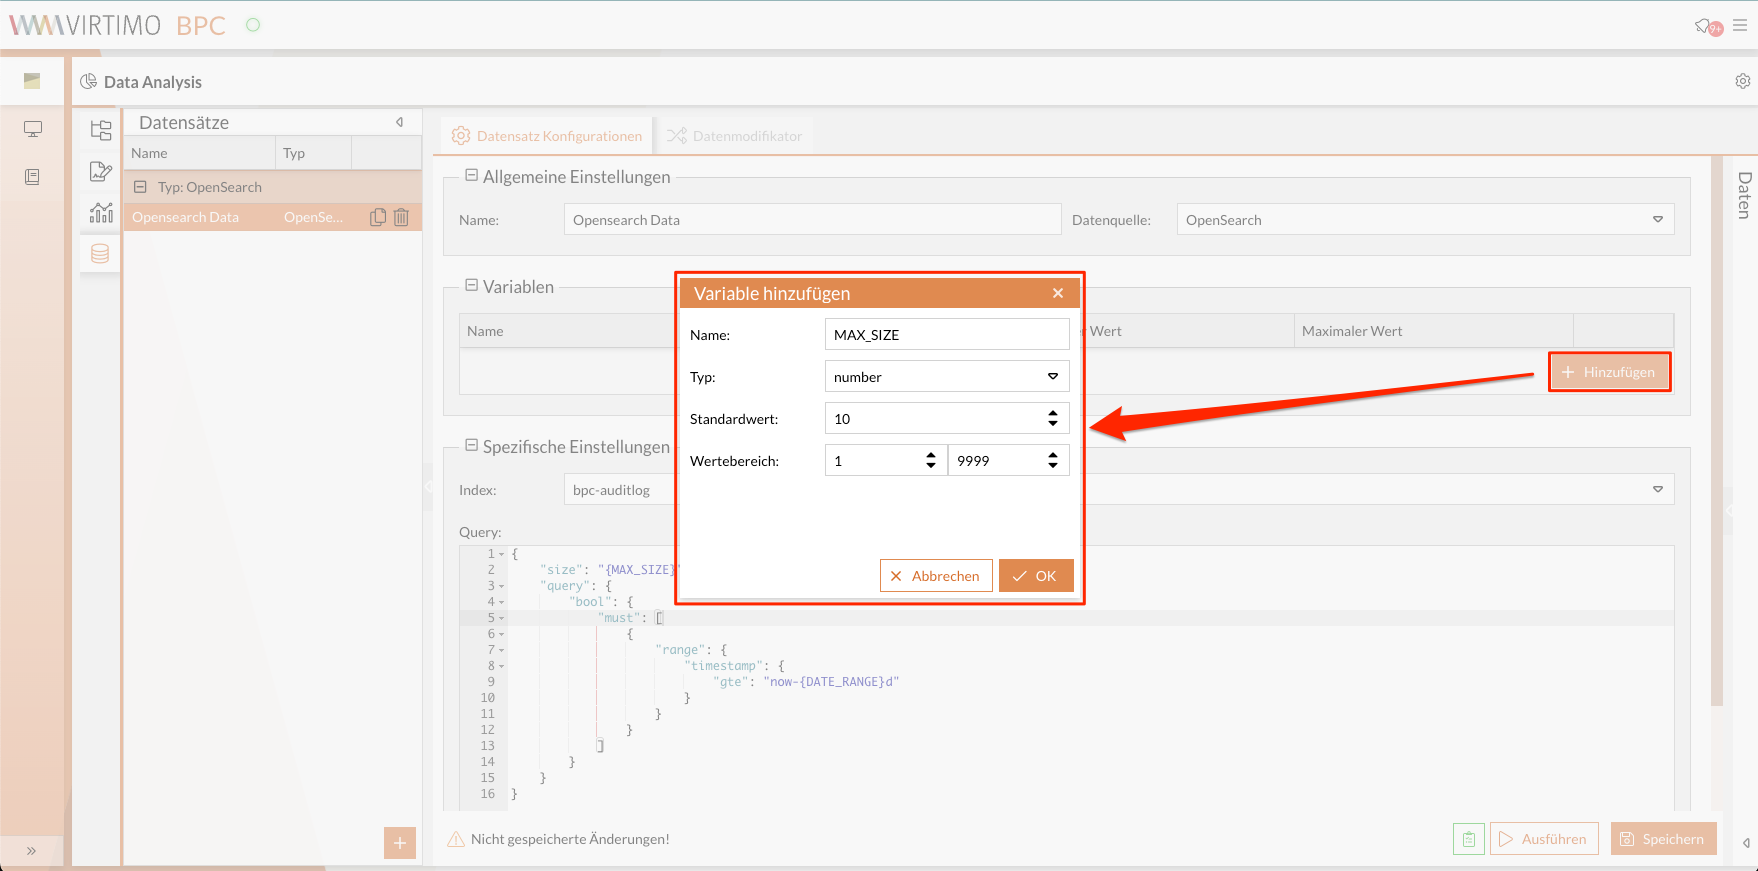
-
Click the Save button.
-
-
Click Run.
When you run the script, the entered data is automatically saved.
The raw data is displayed in the preview window.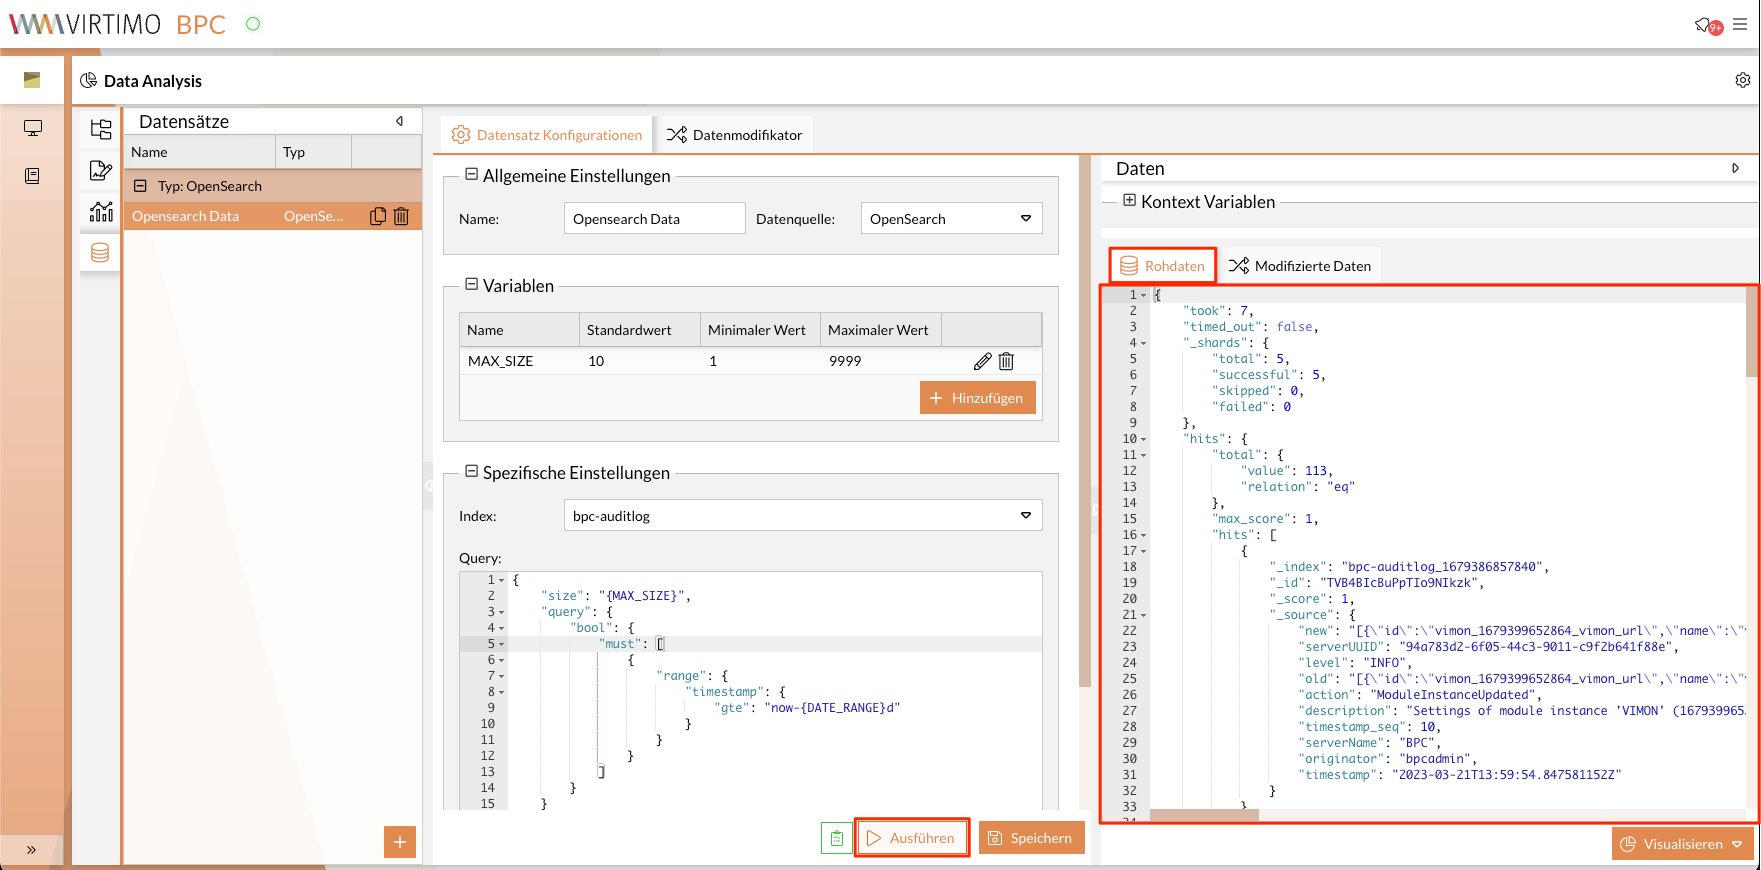
In the preview window, you can expand the variables and adjust them for testing purposes (see Data Preview).
If you make changes to the configurations, always click the Save button at the end!
Modifying the Data Set
Since the various chart types each require specific values, the data sets should be modified accordingly:
| Chart Type | Expected Attribute Value |
|---|---|
Gauge (Pointer Chart) |
number |
Pie (pie chart) |
string for the Label, |
XY chart (line and bar charts) |
string for the text axis, |