Report Editor
A report is a compilation of one or more charts that are thematically related.
For example, you can assign custom titles, enable or disable automatic updates, or specify the order of the included charts.
In addition, access rights can be assigned to individual reports, and variables can be made available to allow users to customize them.
User Interface
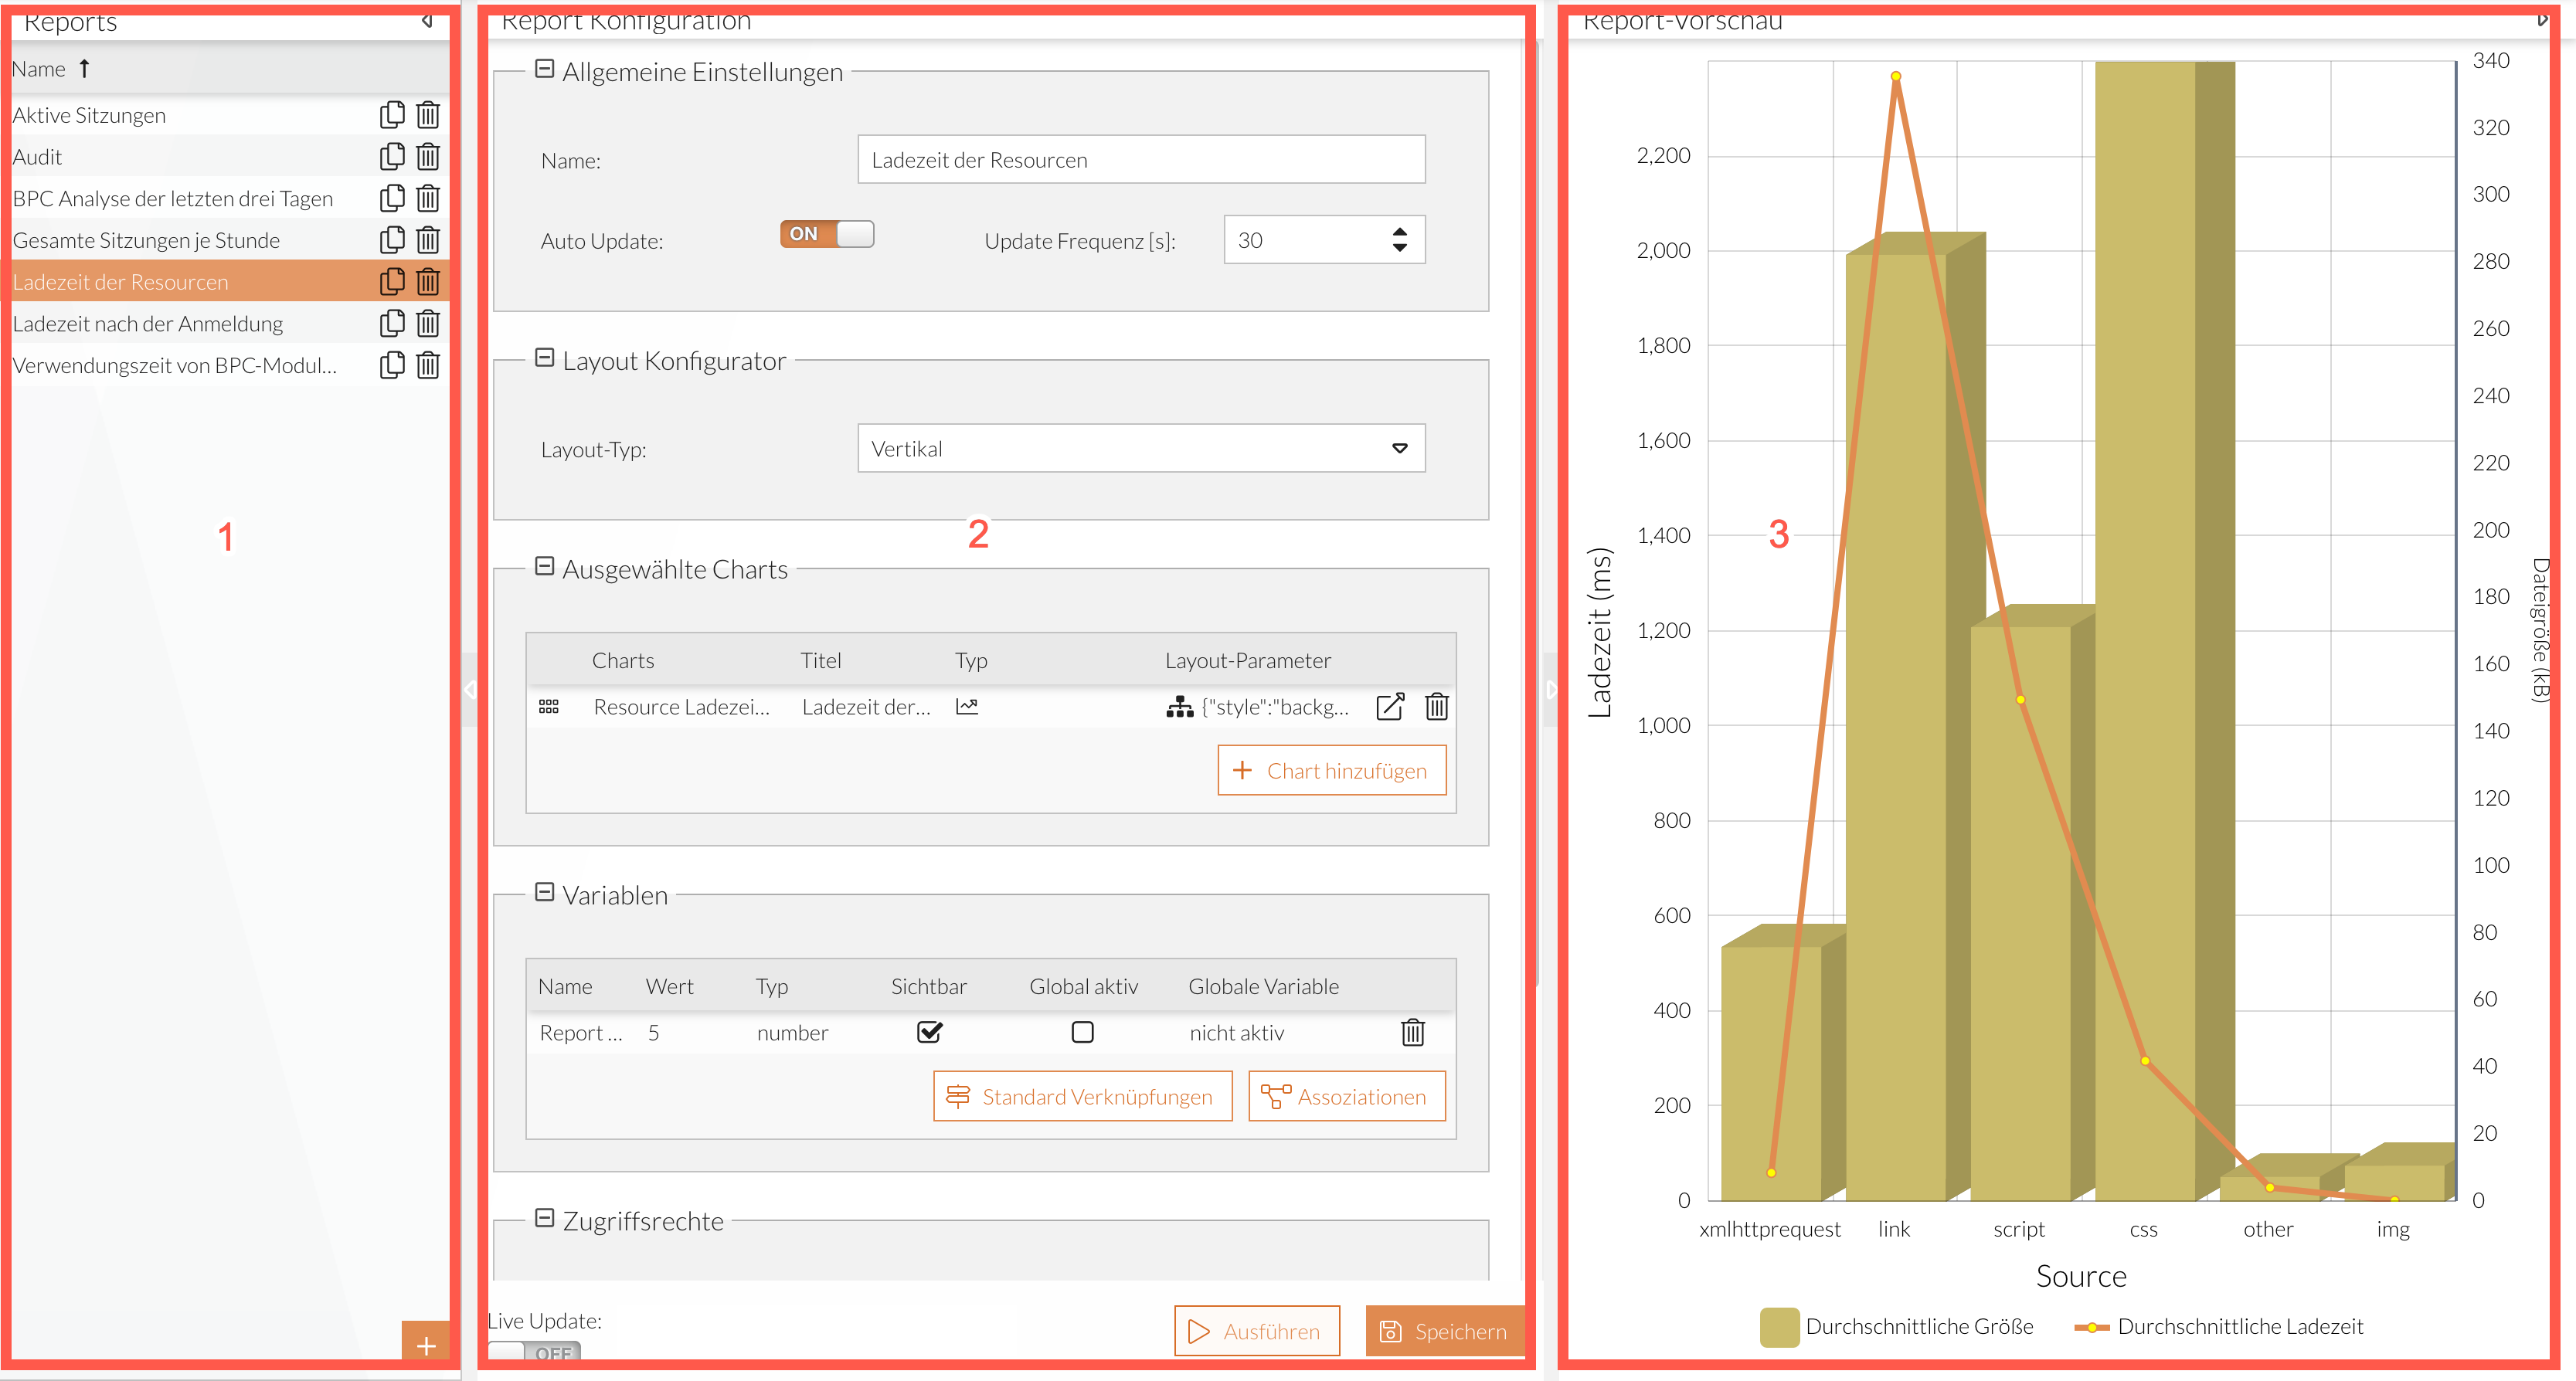
-
Report Overview
-
Configuring a Report (see Configuring a Report)
-
Preview Area of the Selected Report
Adjusting Panels
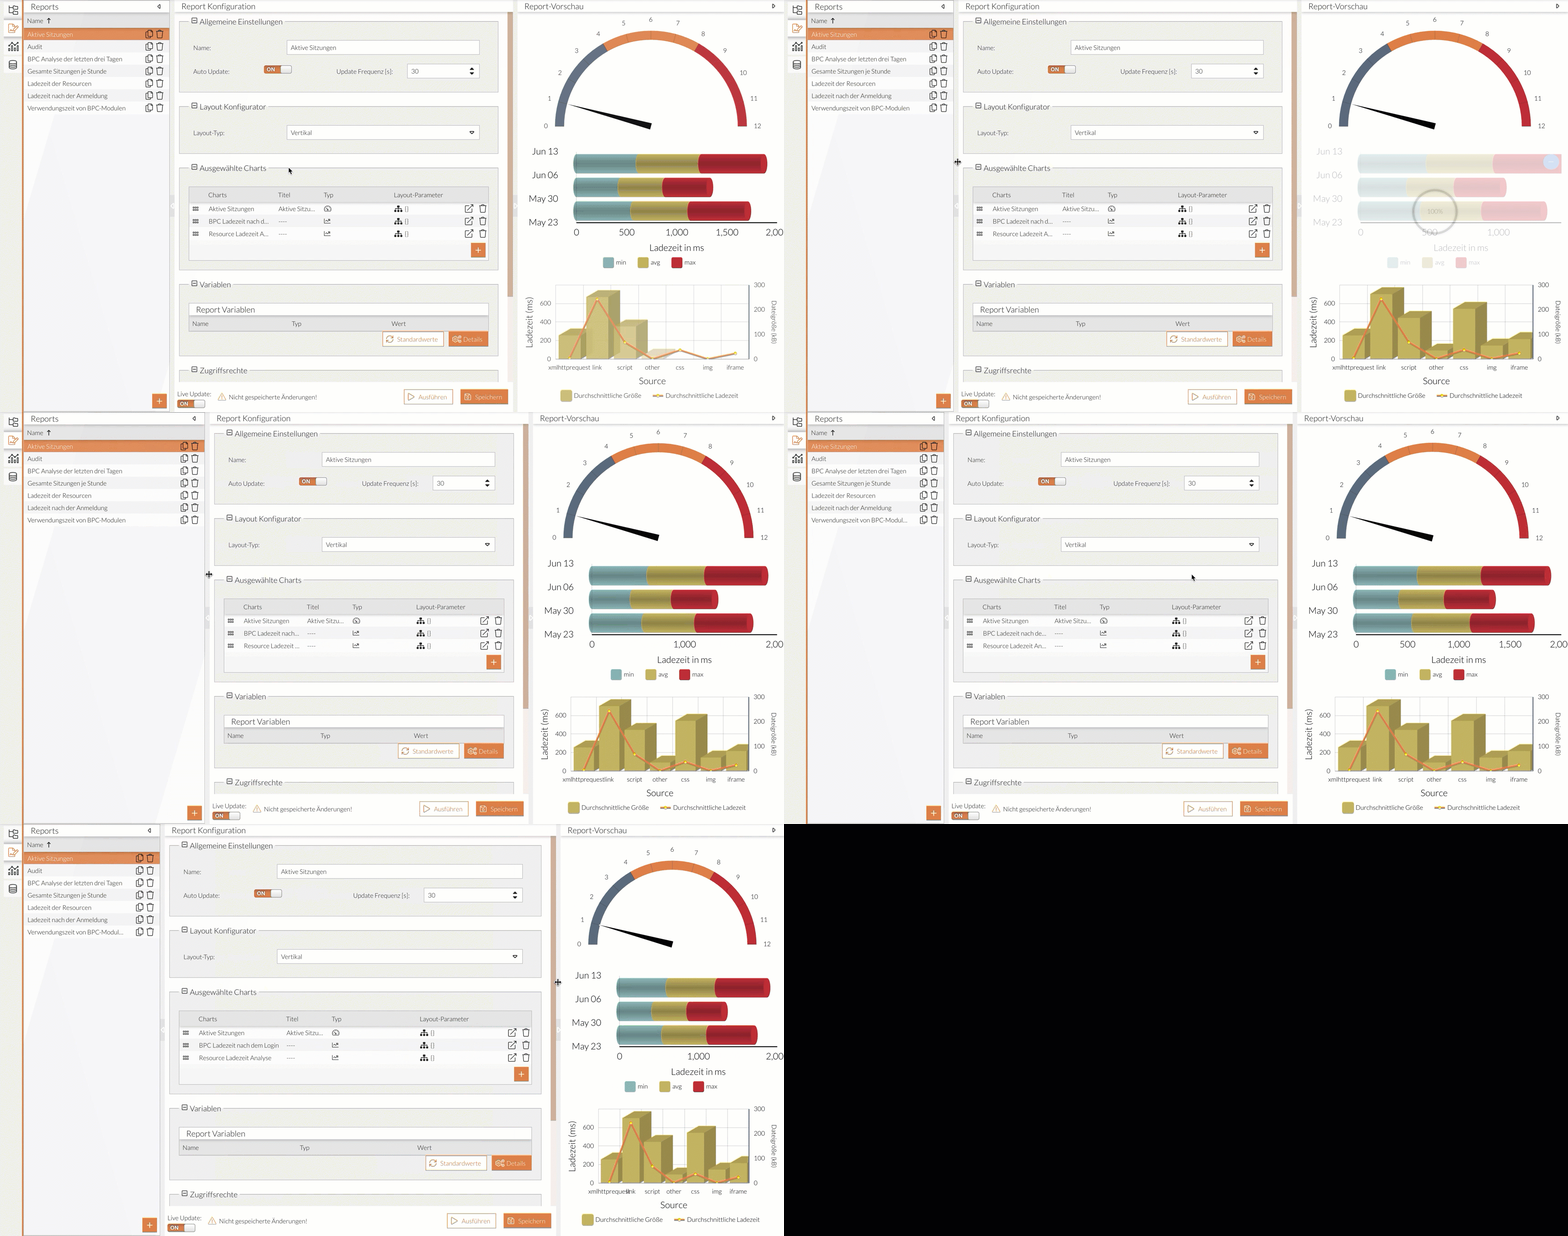
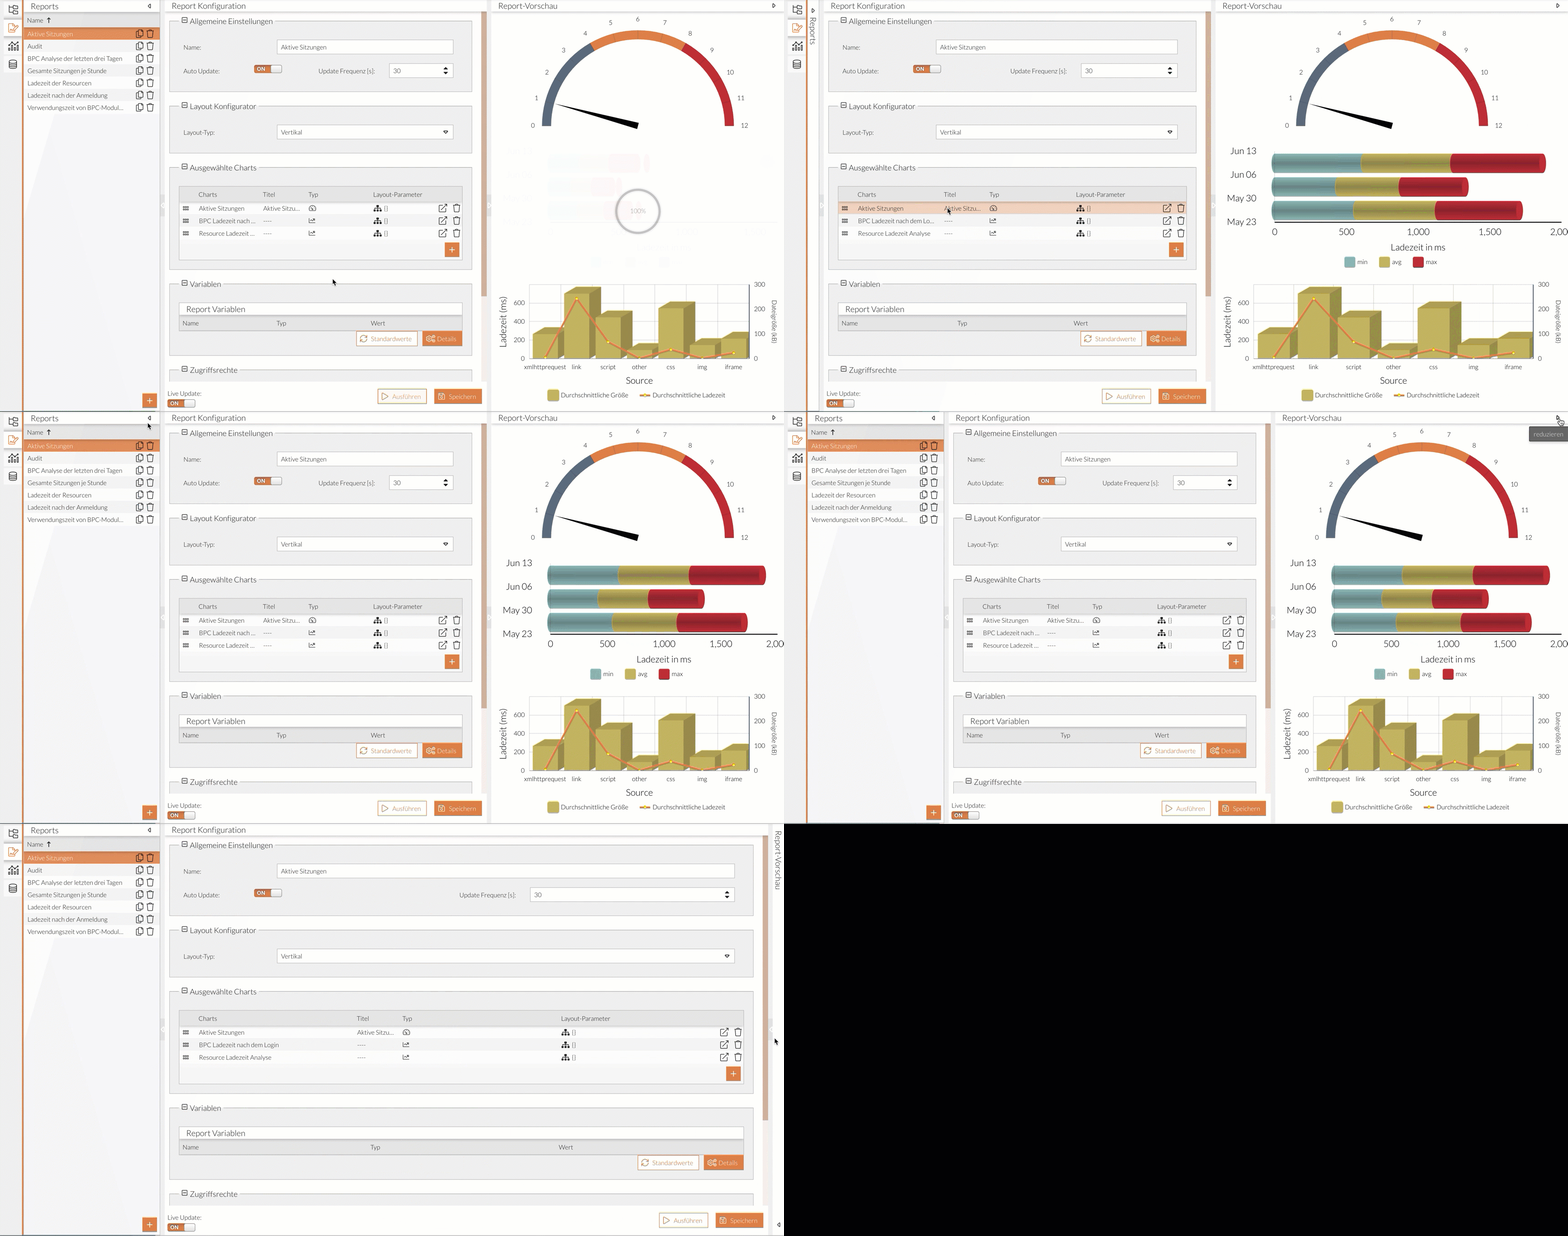
The width of individual panels can be adjusted or the panels can be completely collapsed, for example, to reveal hidden information.
Adjusting Panel Width:
Expanding or collapsing sections:
Live Update
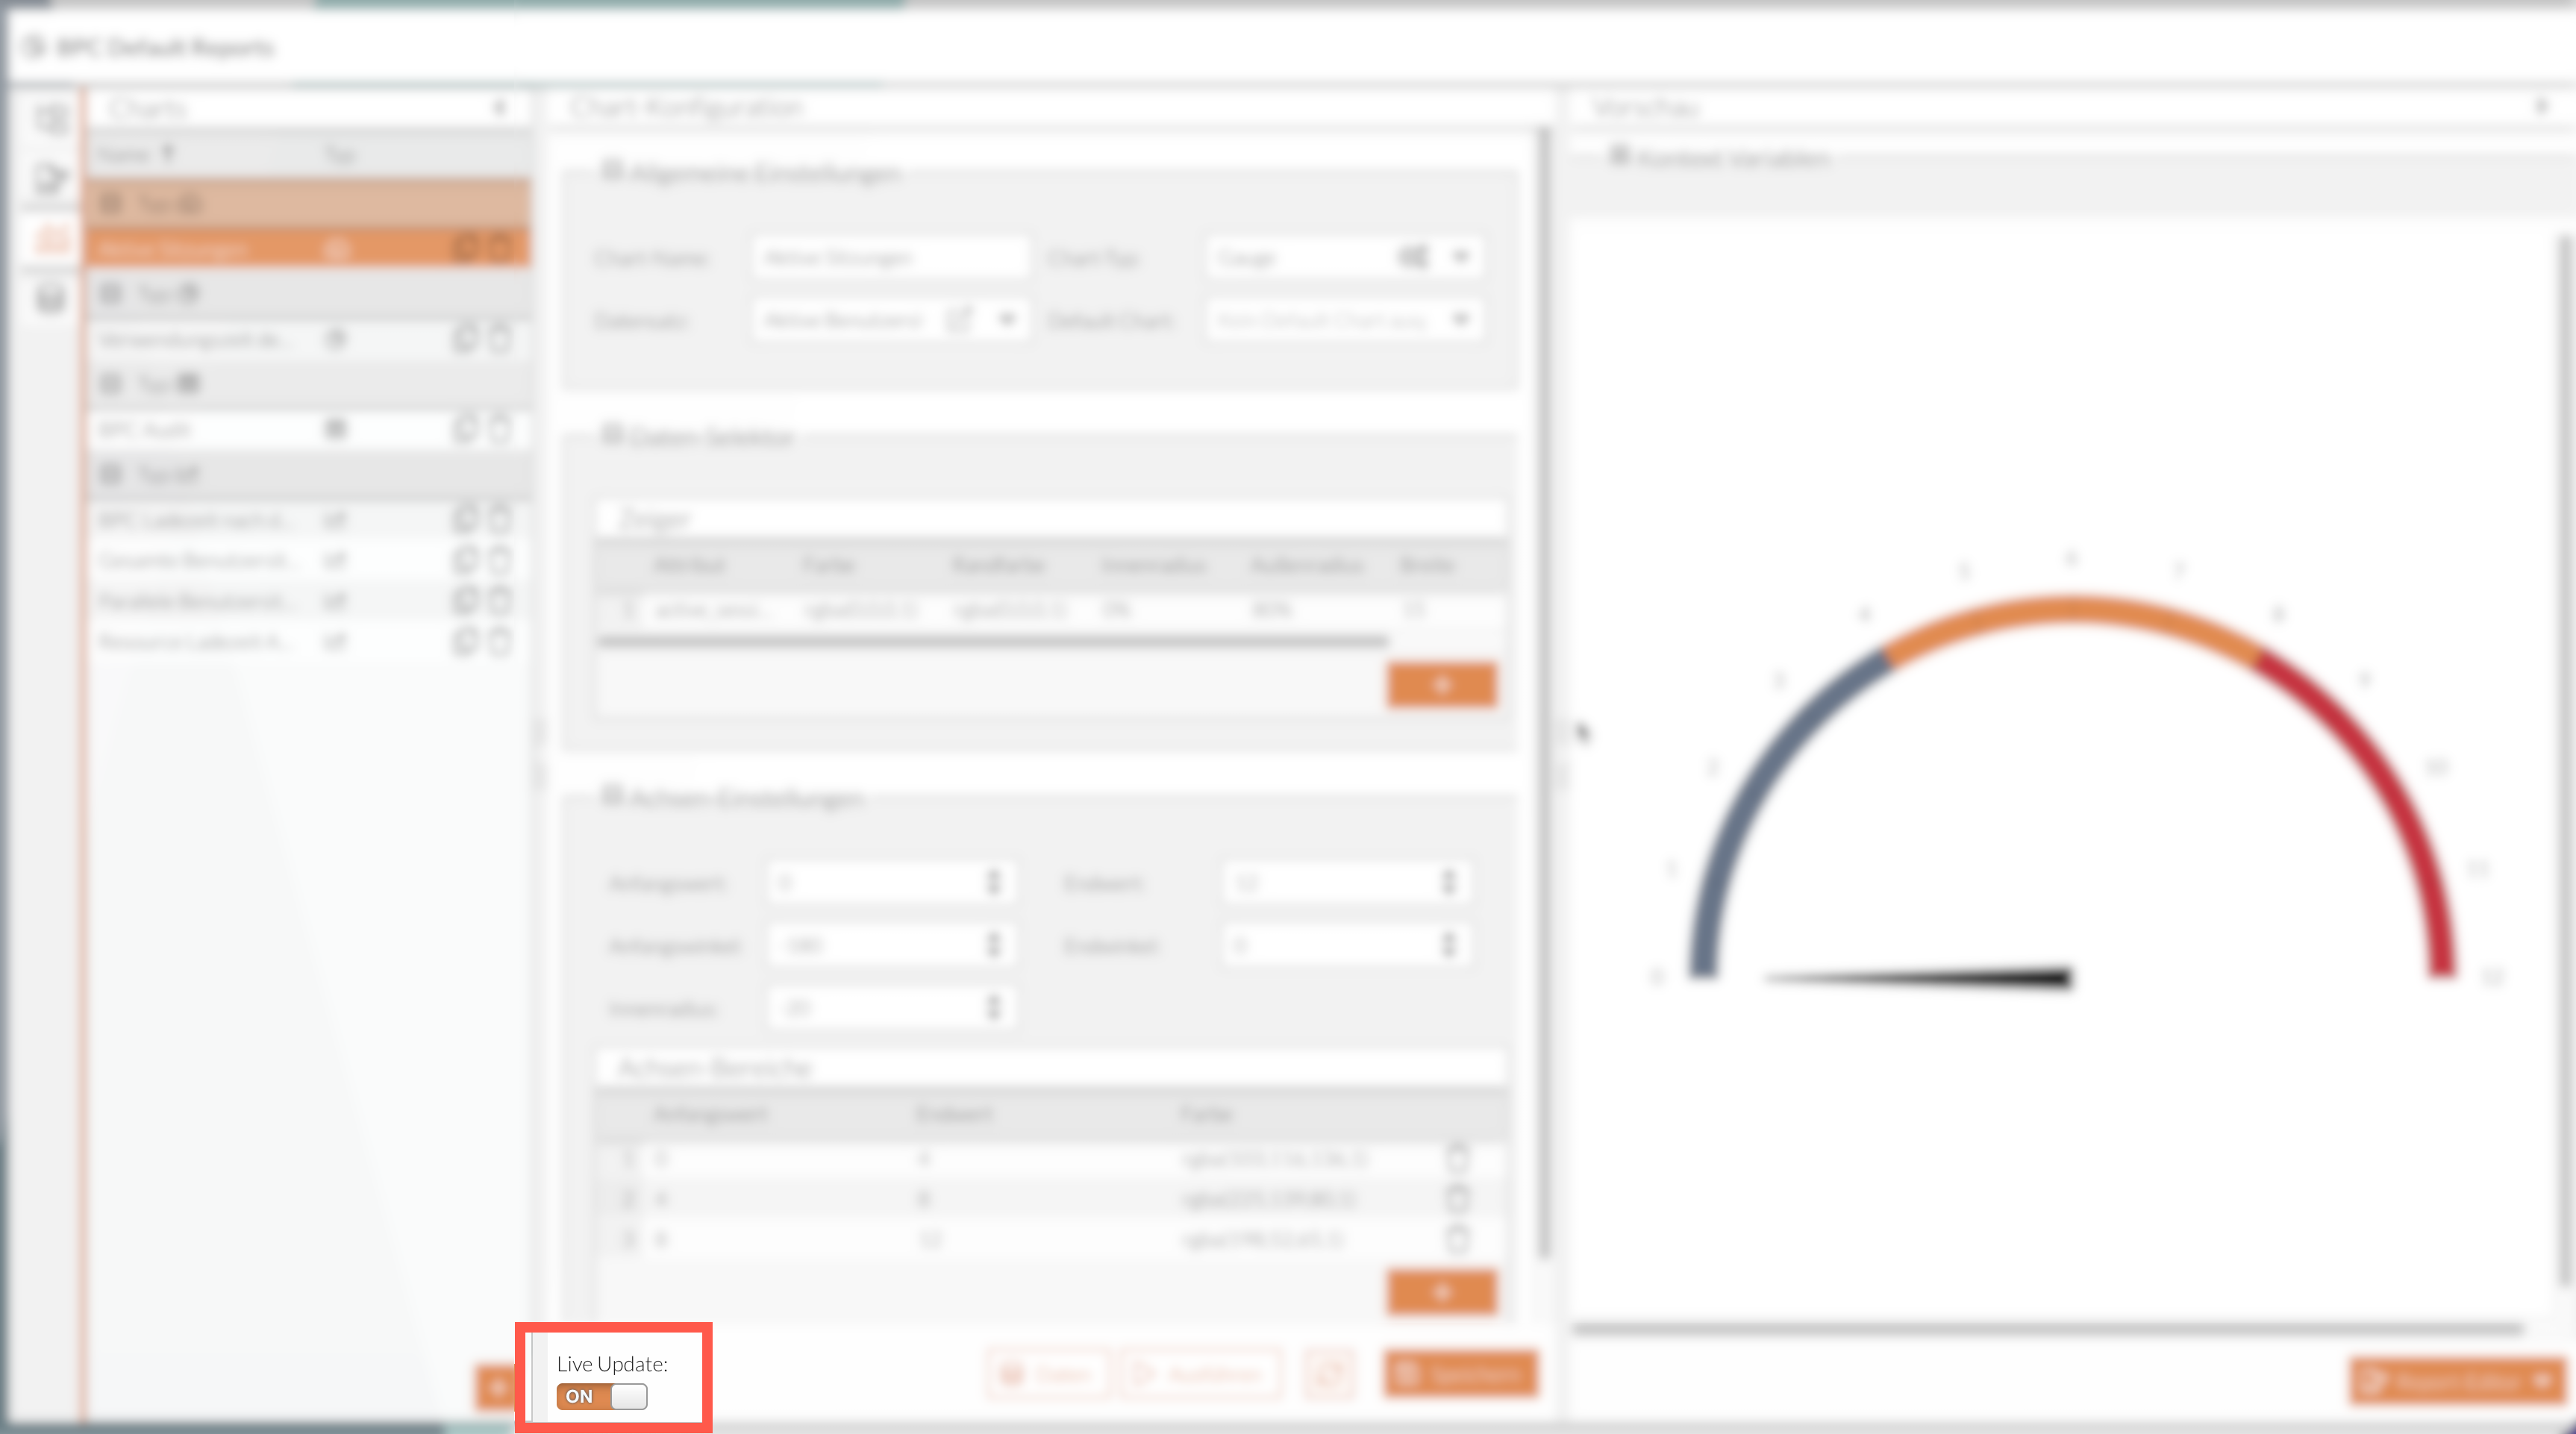
- What is the "Live Update" feature used for?
-
Enabling Live Update ensures that changes to the chart are immediately visible in the preview area.
- When should Live Update be disabled?
-
If you need to display comprehensive charts with many data points, rendering and visualizing the charts requires more resources. Depending on your individual resources, this may affect the application’s performance.
Therefore, if you notice or expect limitations during configuration or slow rendering in the preview area, disable Live Update.
Add/Manage Reports
| Button/Icon | Description |
|---|---|
Add |
Creates a new element. |
Duplicates the selected report, including all configurations, and adds the copy to the list. |
|
Removes the selected element. |
|
Run |
Generates a report based on the existing configurations. |
Save |
Saves the configurations or changes. |
Configuring a Report
Here you will find the available report settings. Adjustments can be made in the following sections:
General Settings
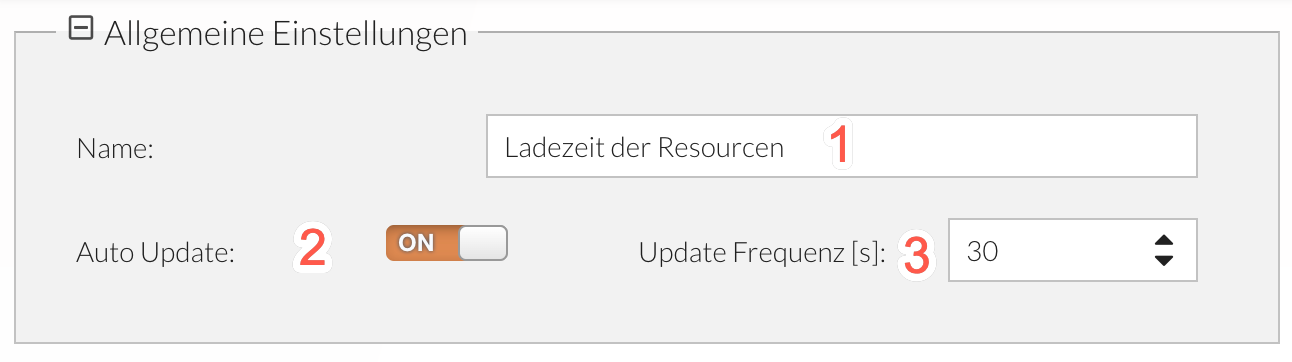
-
Report name.
-
Enable/disable automatic reloading of a report.
-
The interval in seconds at which the automatic update is repeated.
If auto-update is disabled, this setting has no effect.
Layout Configurator
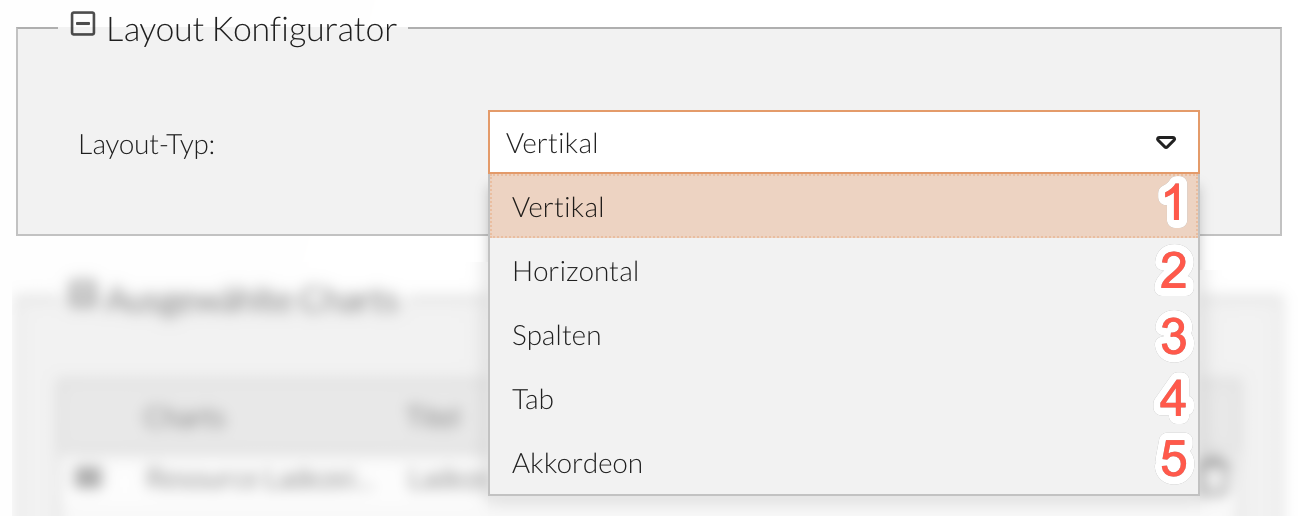
In the Layout Configurator, you can determine the arrangement of the charts.
The following options are available:
-
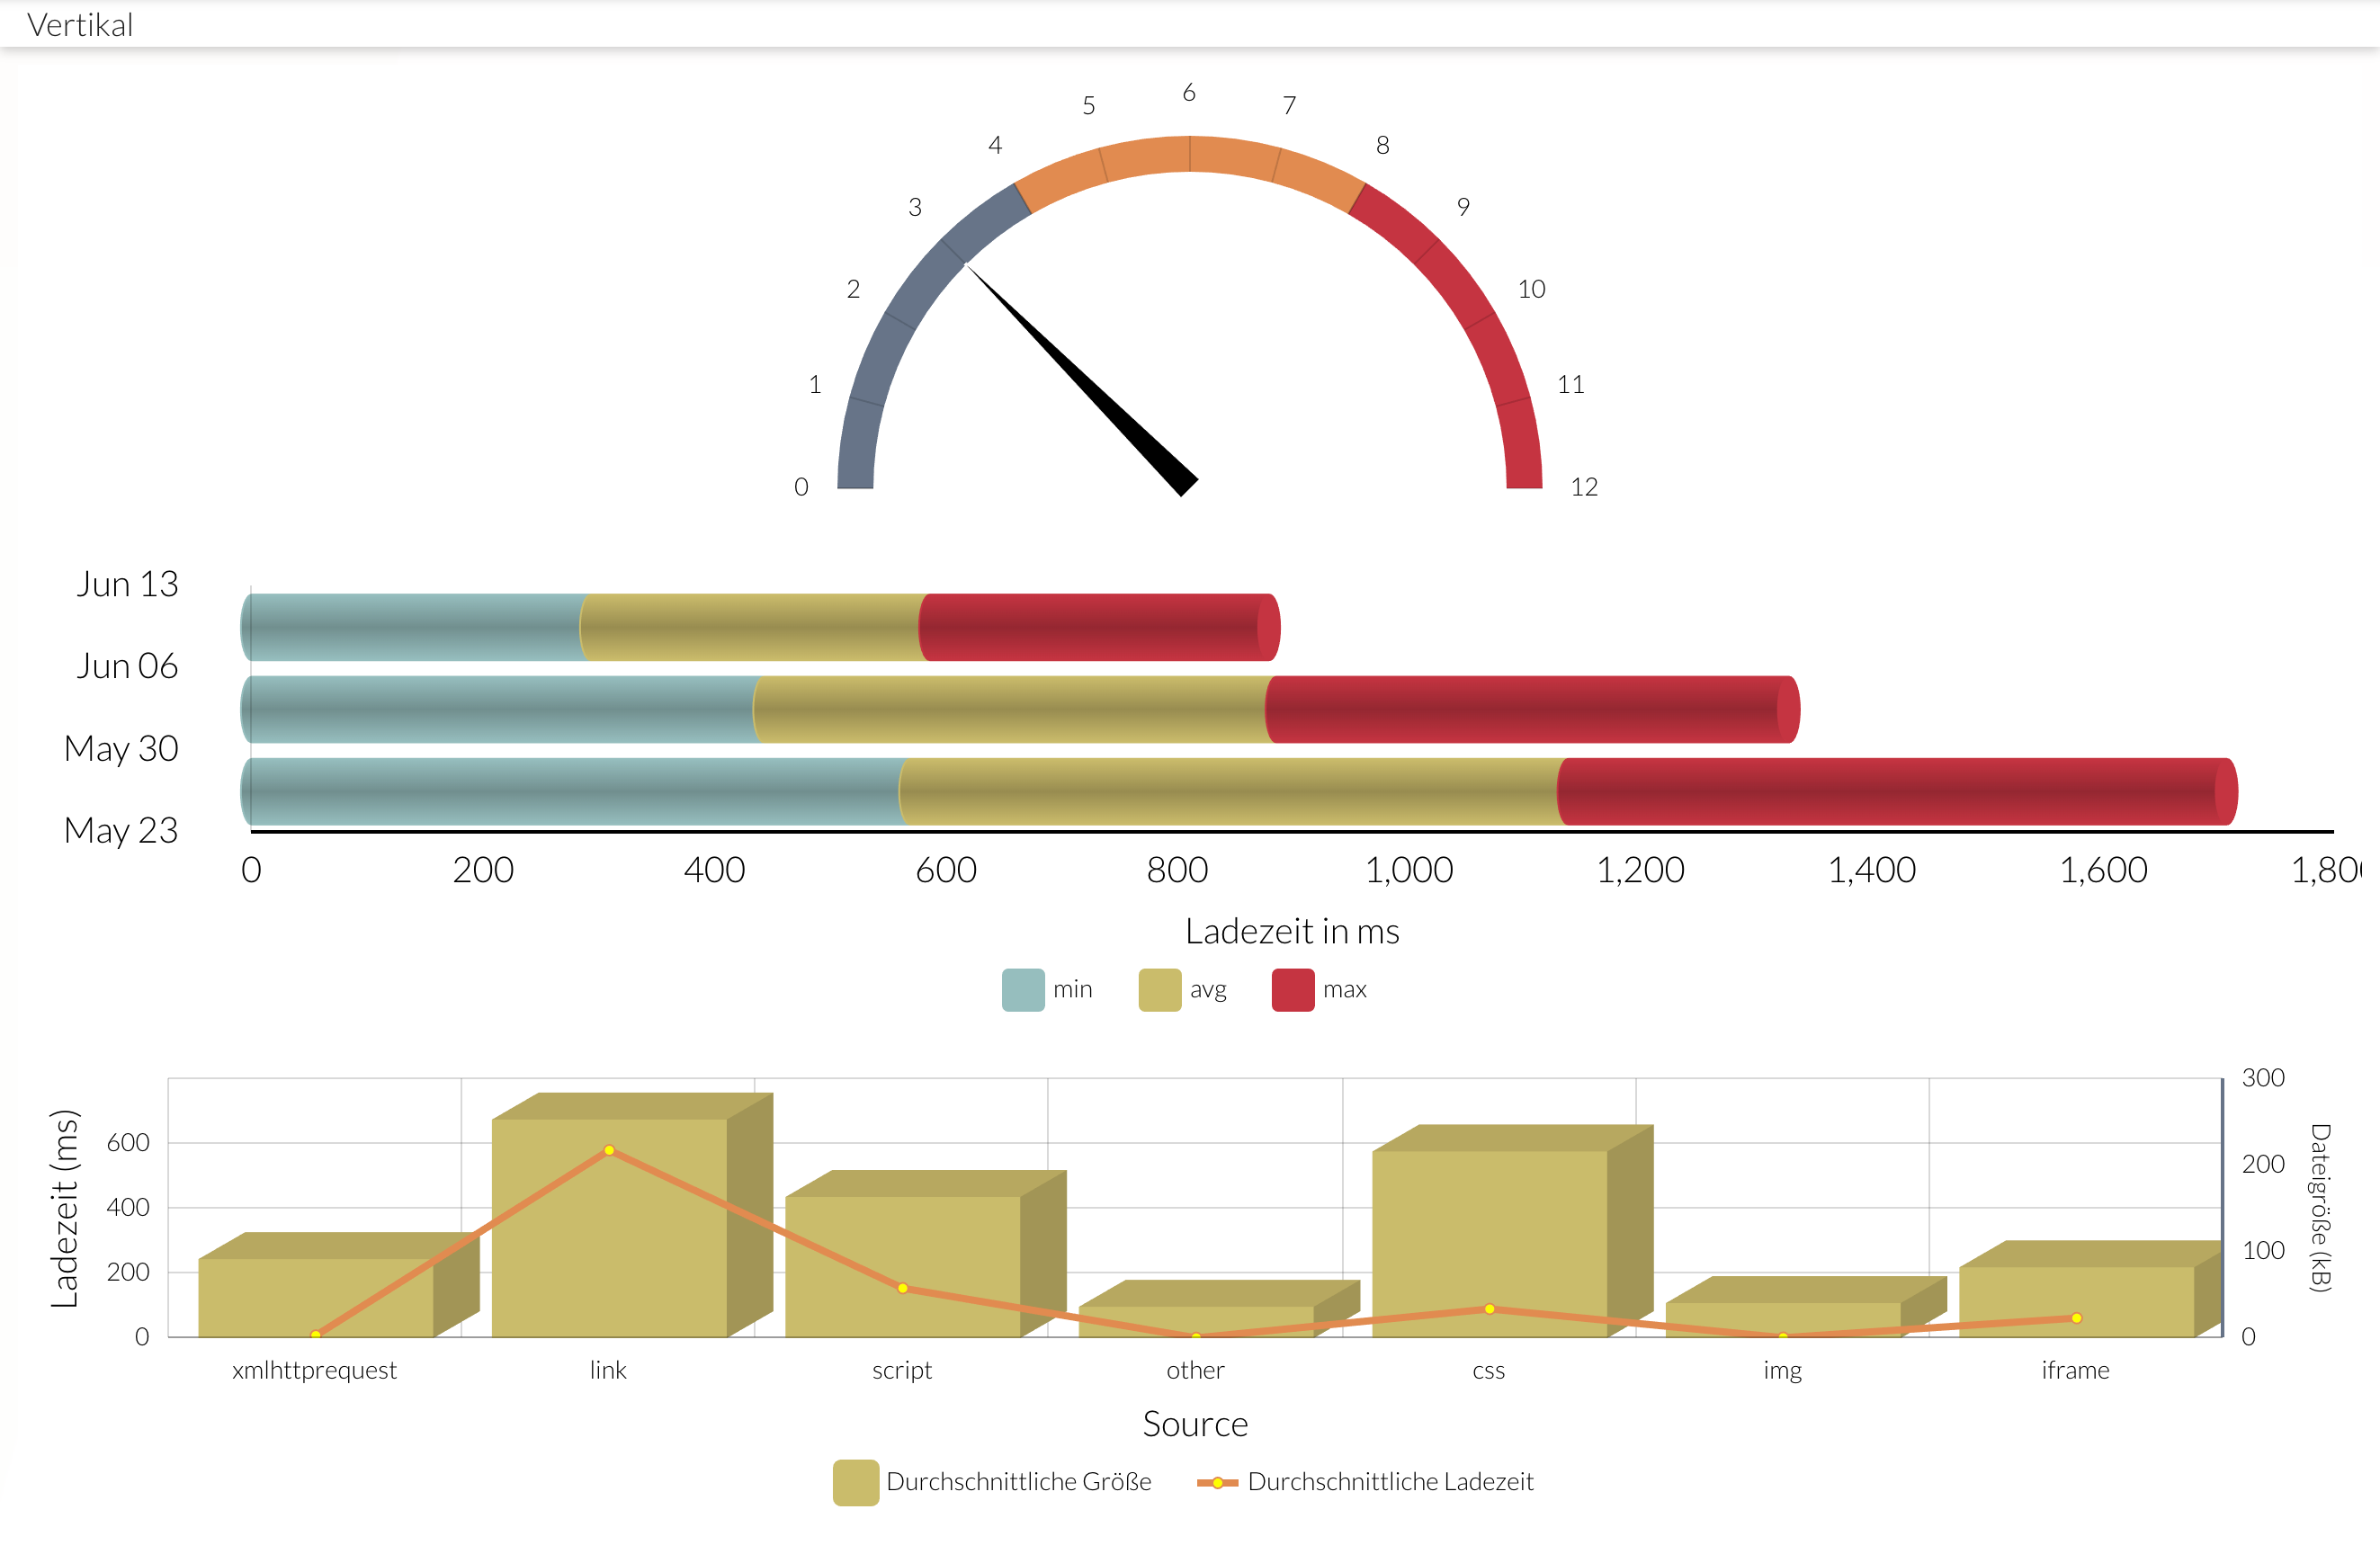
Vertical: Each chart occupies the full width and shares the height with the other charts.
See the ExtJS documentation for configuring horizontal layouts.Example of vertical arrangement
-
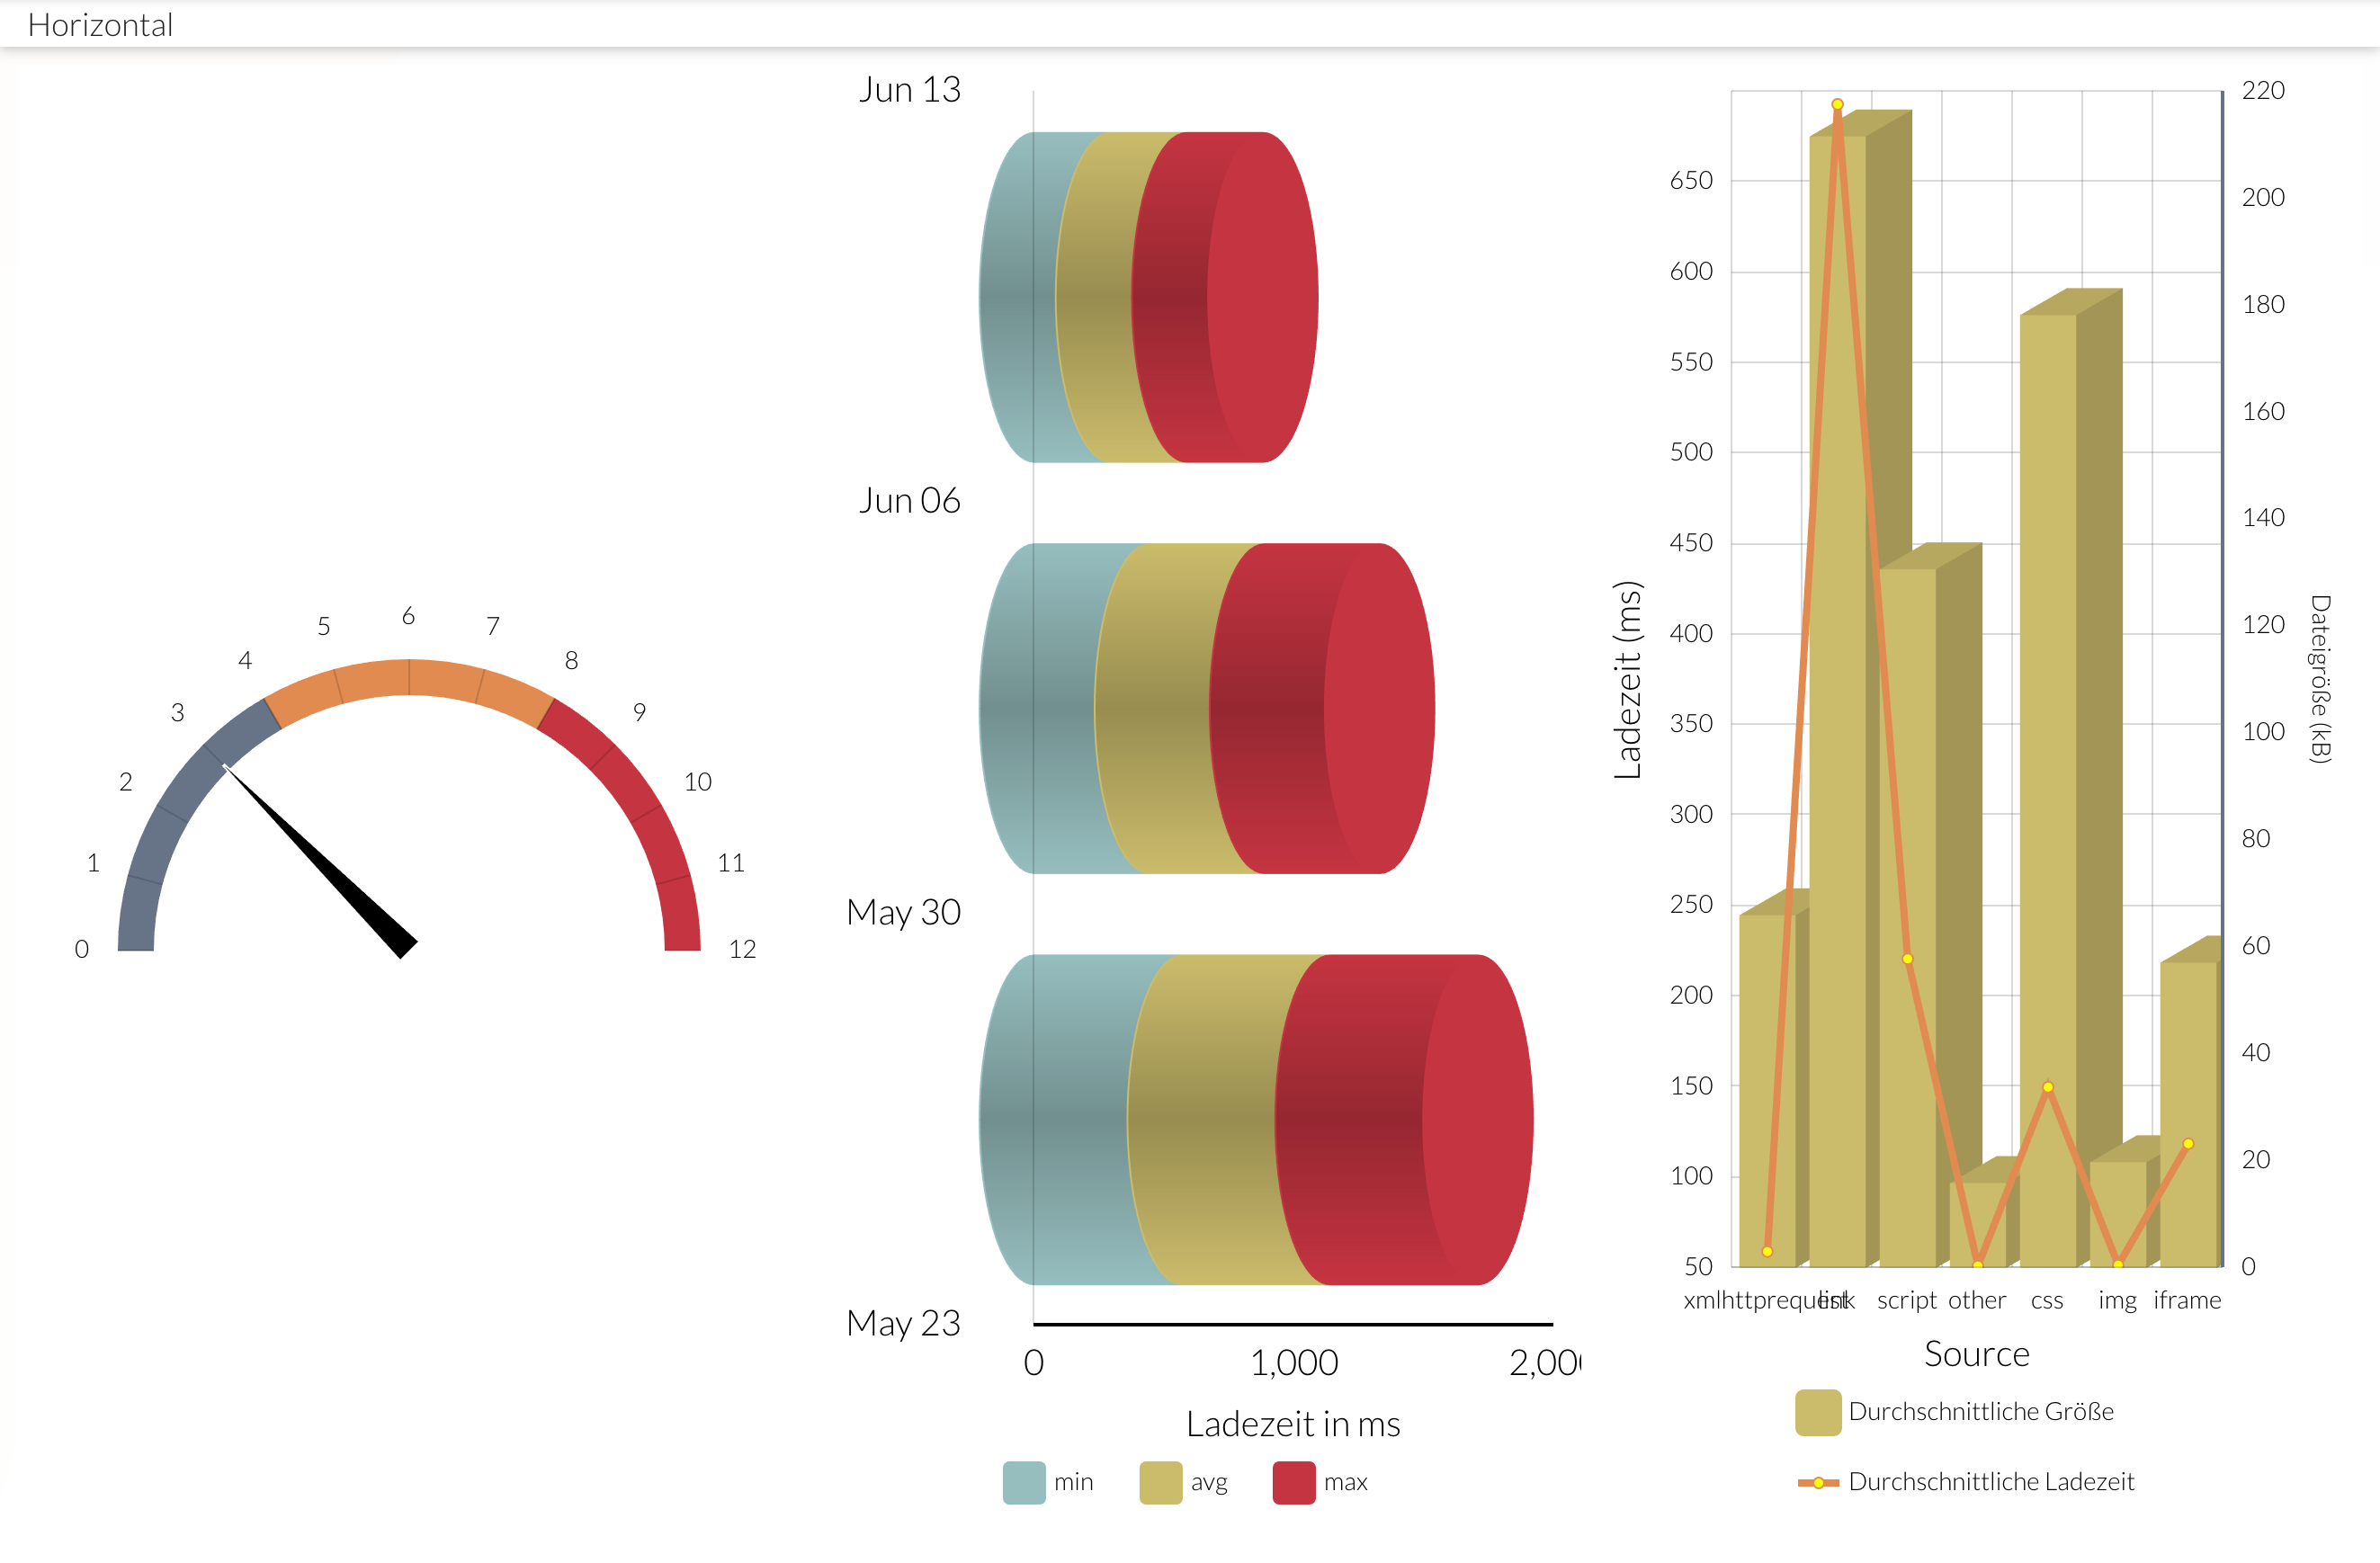
Horizontal: Each chart takes up the full height and shares the width with the other charts.
See the ExtJS documentation for configuring horizontal layouts.Example of horizontal arrangement
-
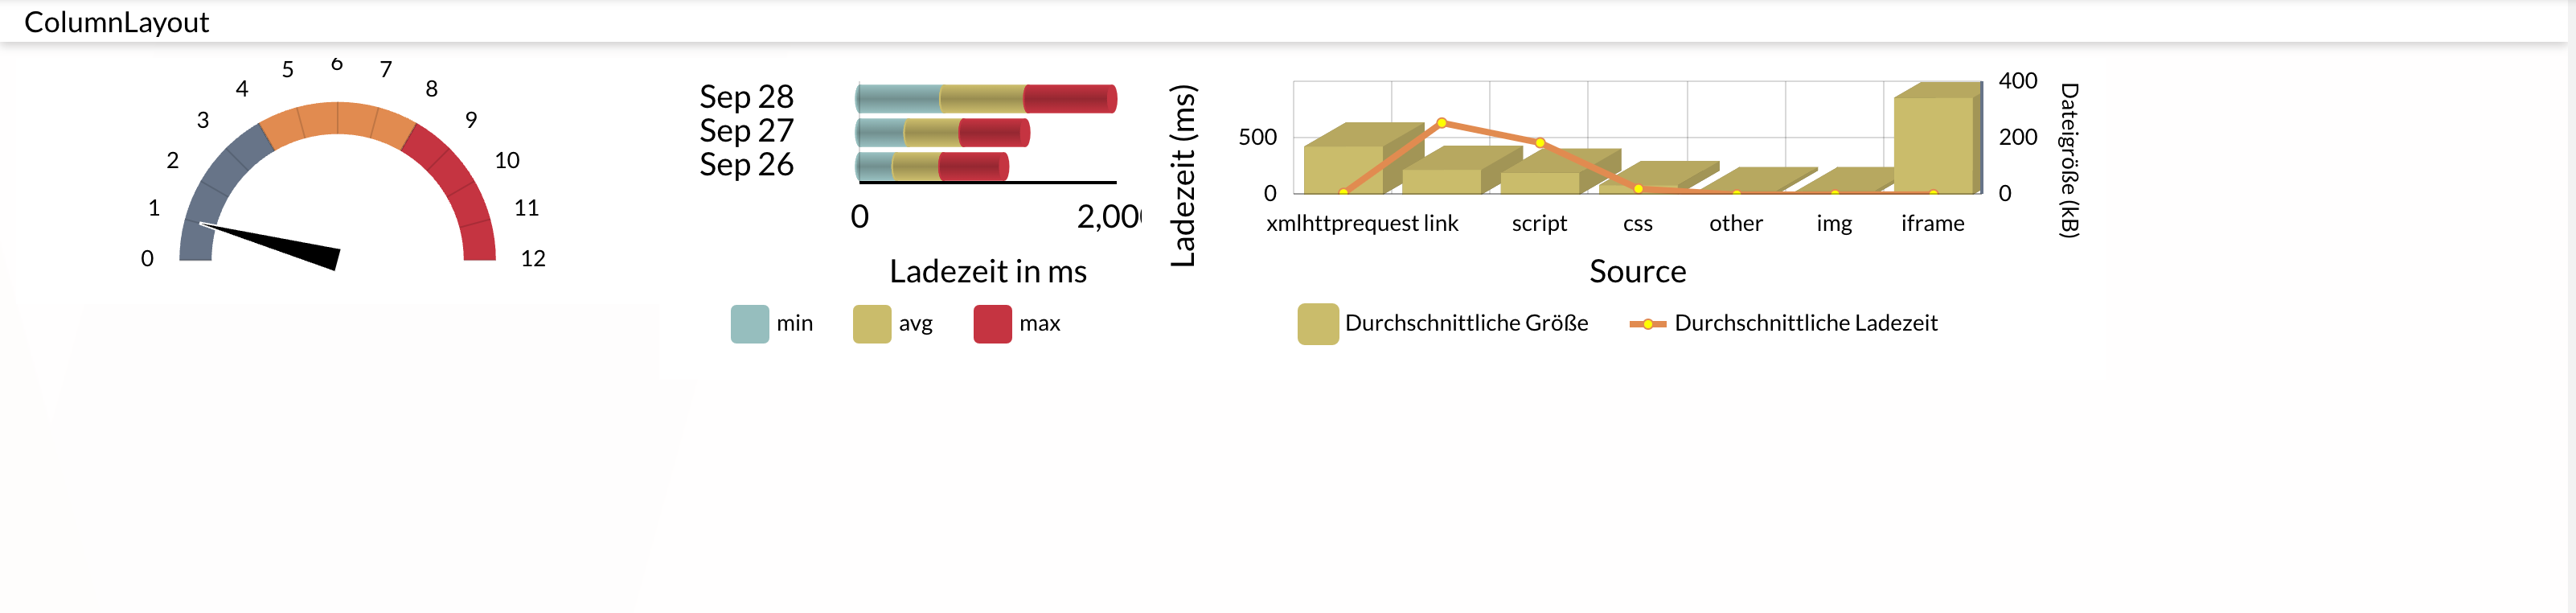
Column layout.
See the ExtJS documentation for configuring column layouts.Example of a column layout
-
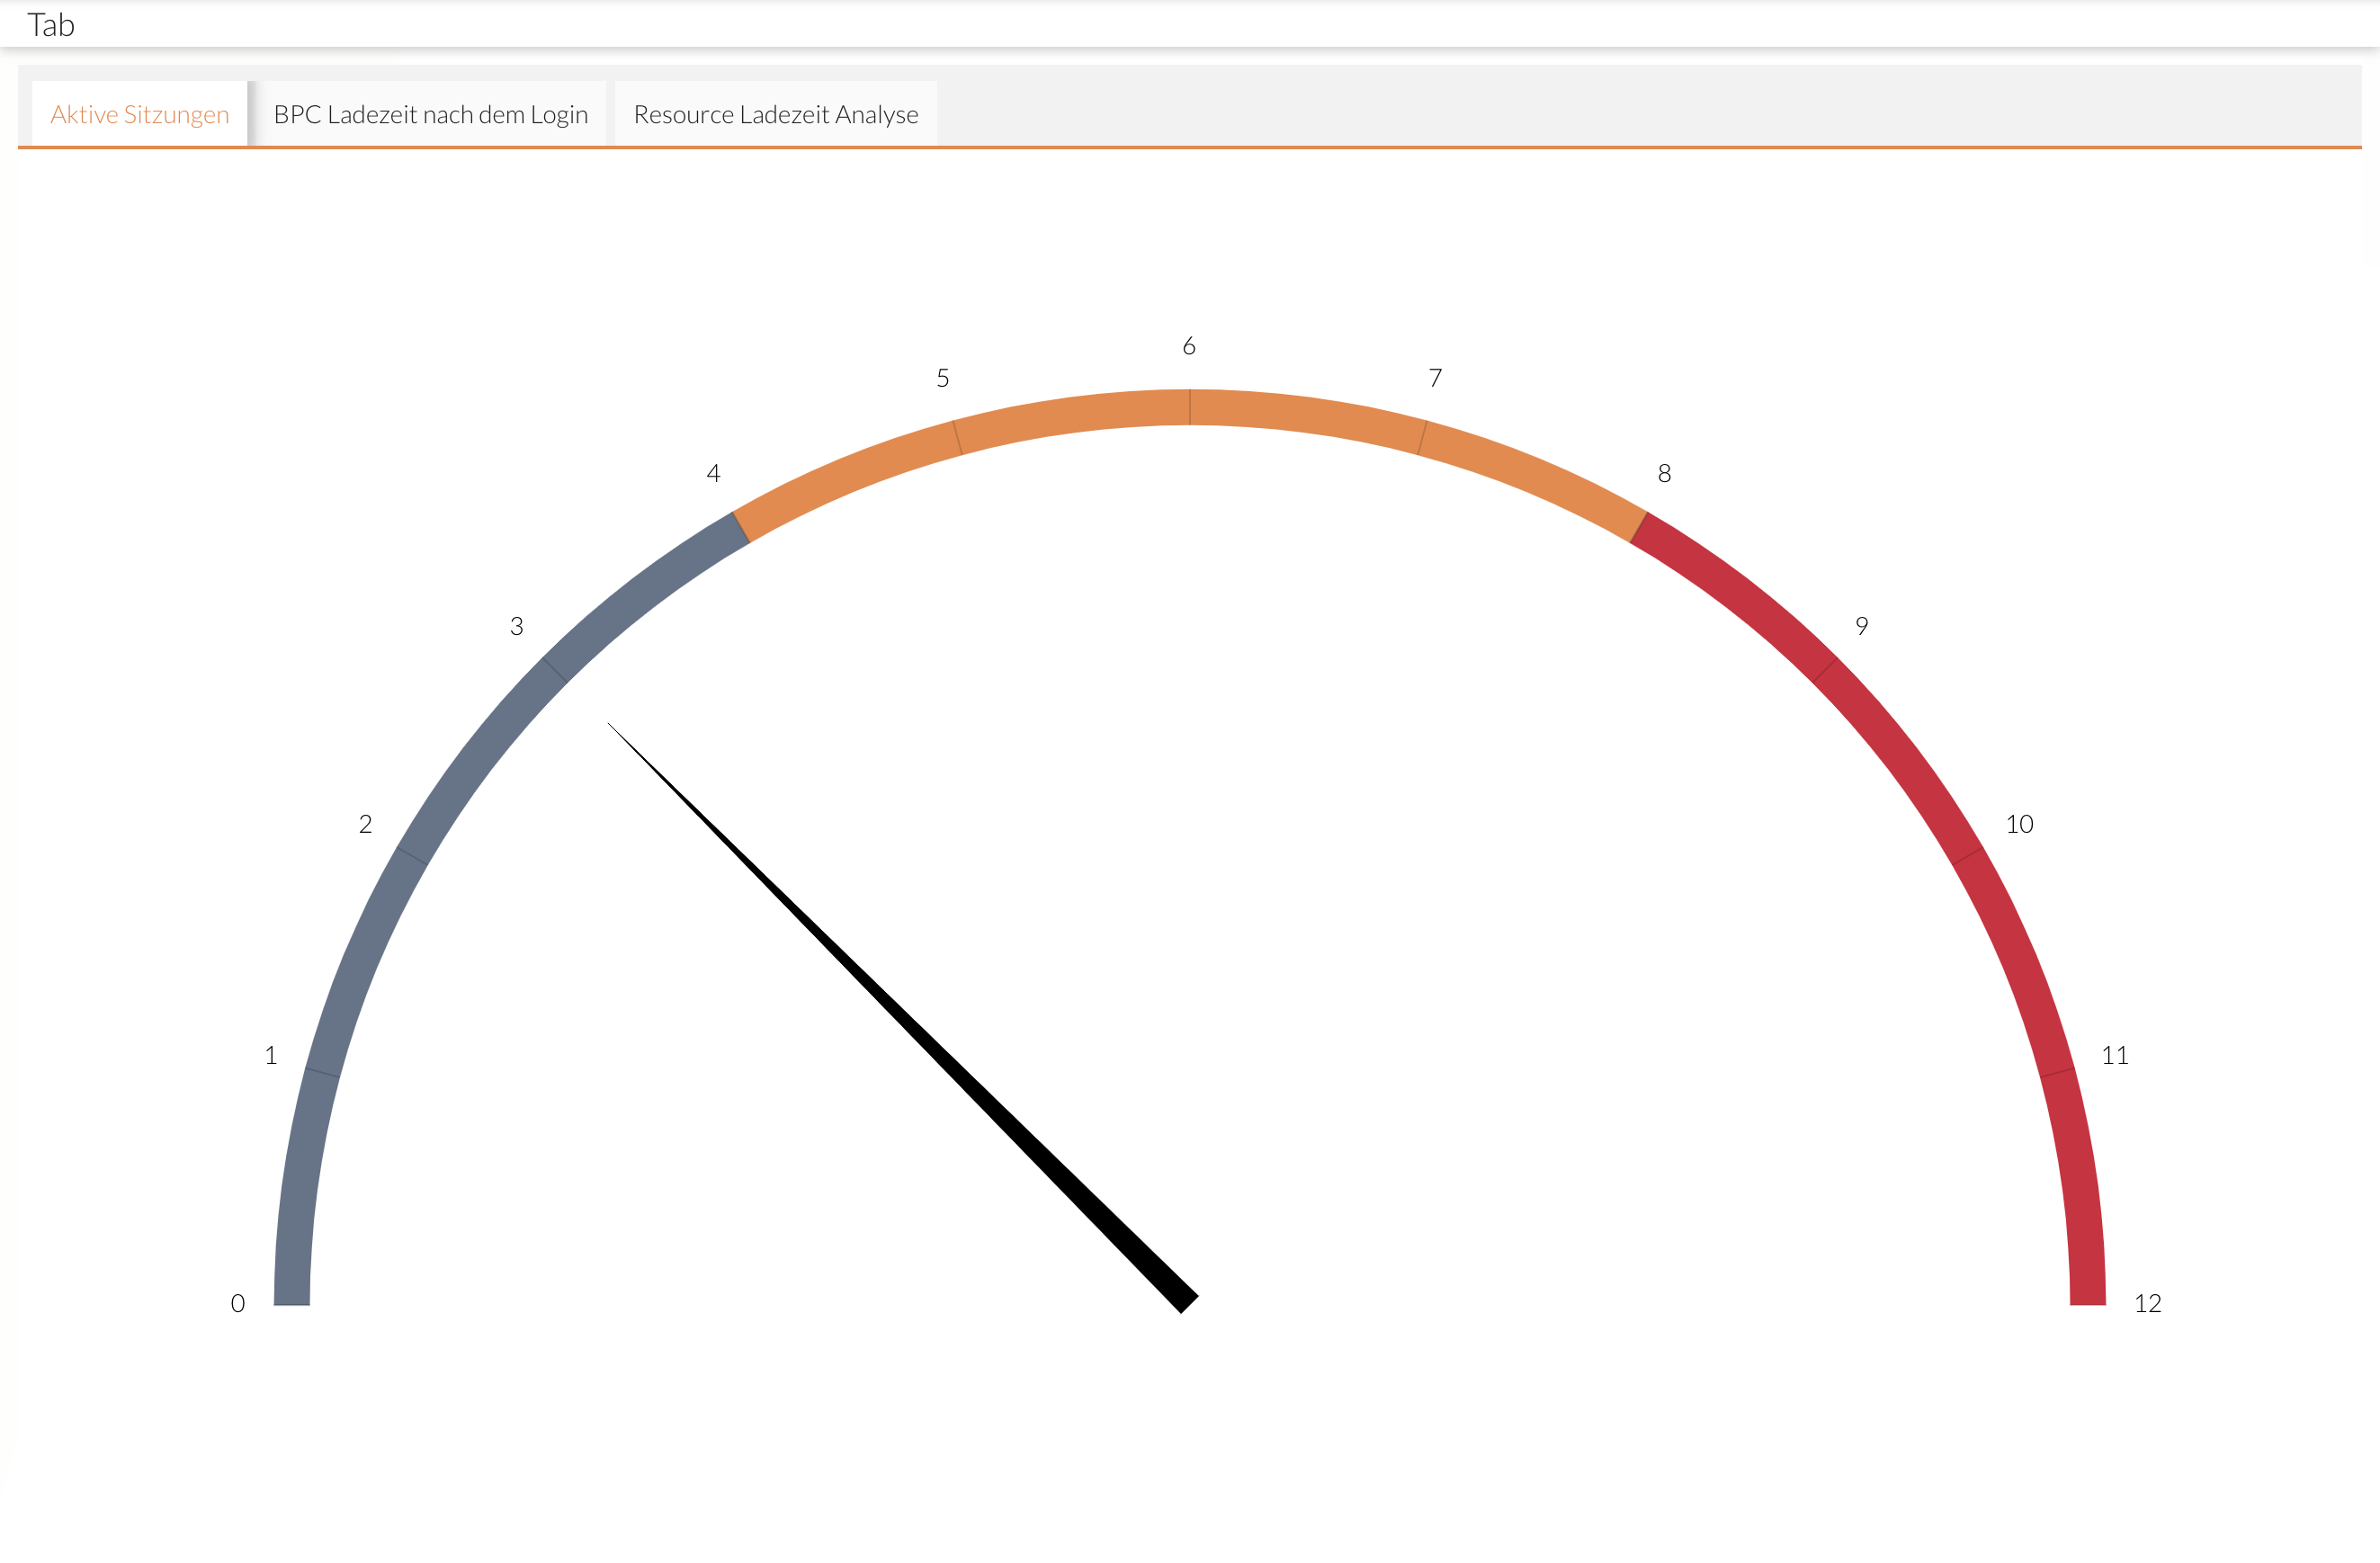
Tab layout.
See the ExtJS documentation for configuring tabs.Example of a tab layout
-
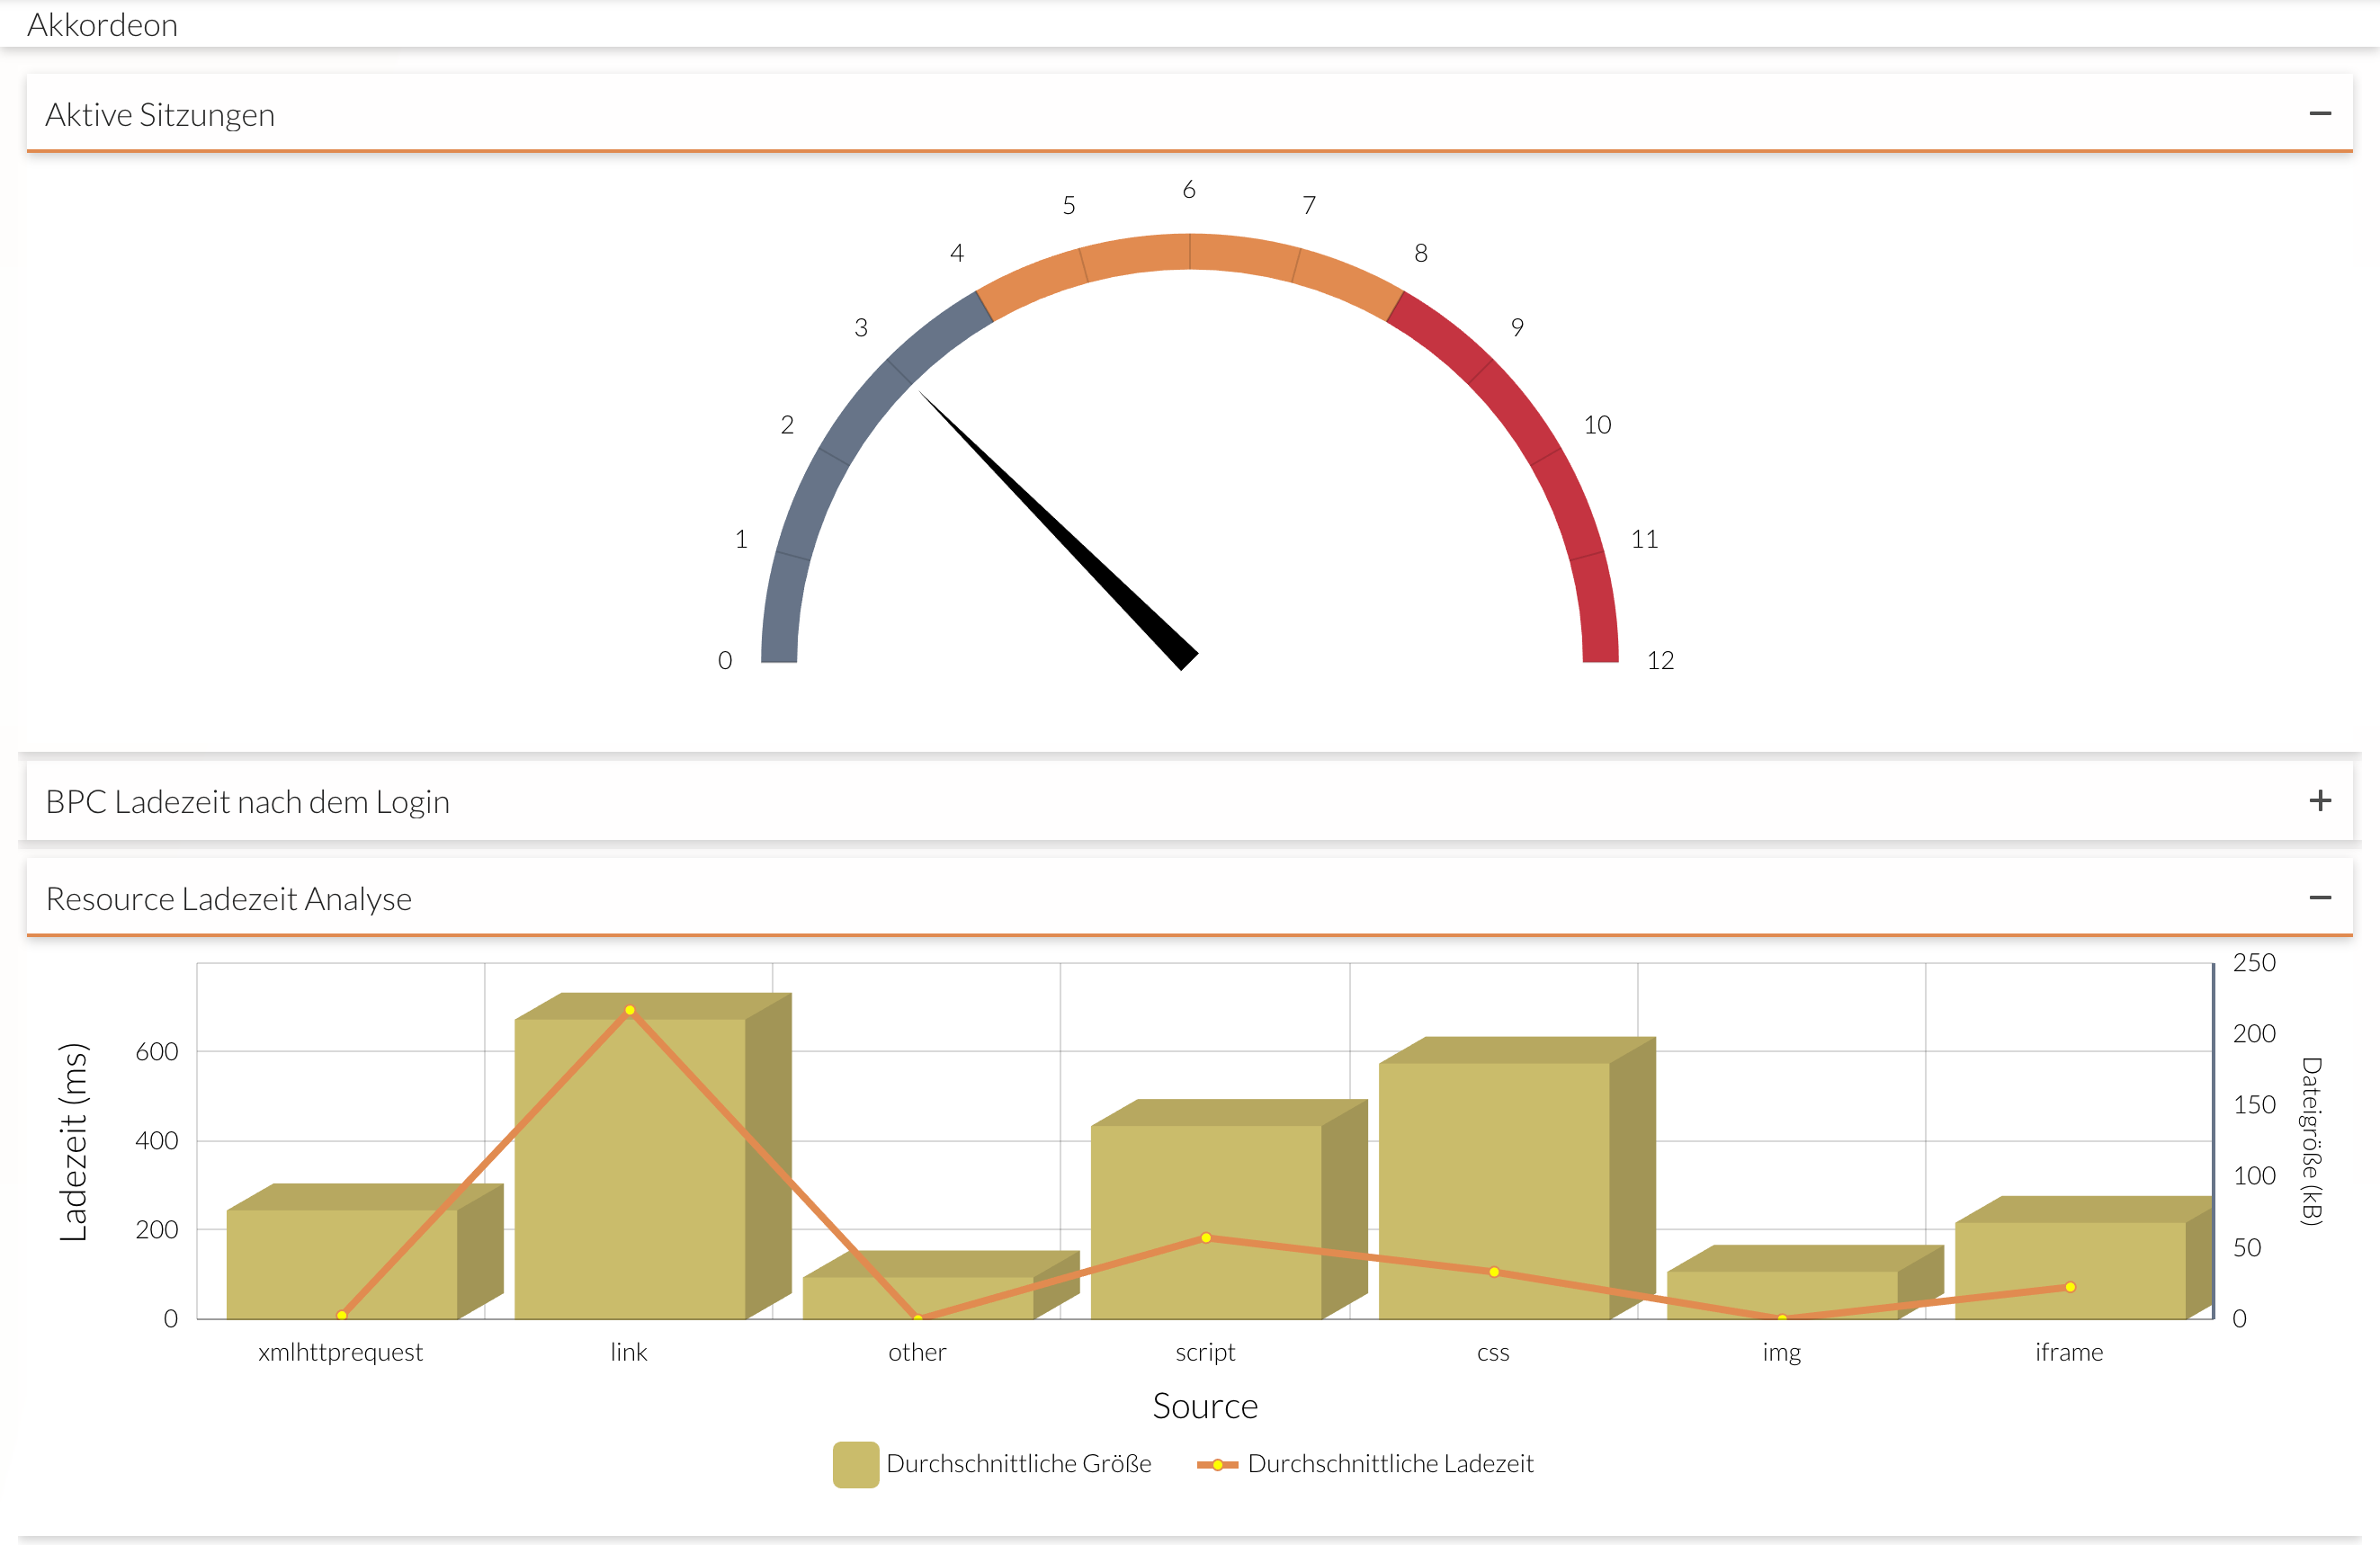
Accordion Layout
See the ExtJS documentation for configuration as an accordion layout.Example of an accordion-style layout
Selected Charts
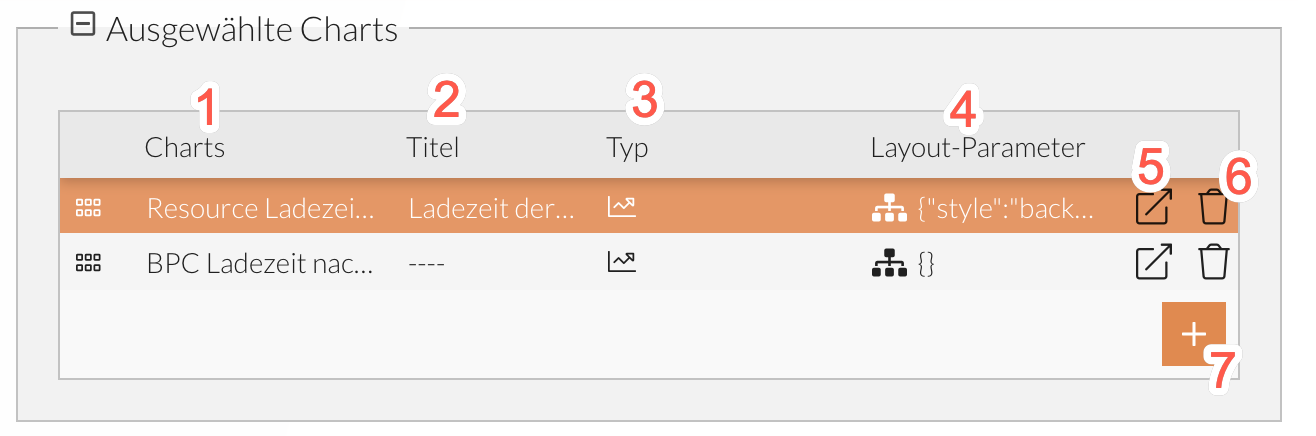
Charts are selected in the report using a tabular view.
The table contains the following columns:
-
Selection of all charts created for the current module component.
-
Title that can be assigned as an alternative to the chart name. This is displayed, for example, as a heading in the tab layout.
-
Chart type of the selected chart, displayed as an icon (cannot be changed).
-
JSON field for assigning additional 'ExtJS' layout parameters to individual components (e.g.,
\{"flex" : 2}).
Varies depending on the layout type (see Layout Configurator). -
Edit chart.
Opens the chart editor for editing. -
Remove chart.
Removes the selected chart from the report. -
Add chart.
Adds a new chart to the report.
Variables
Report variables can be defined in the Variables Configurator to make charts customizable for users.
These variables are created at the report level and can be associated with charts and their underlying dataset variables (see Dataset Variables).
This allows users, for example, to specify the time intervals or date ranges they want to view.
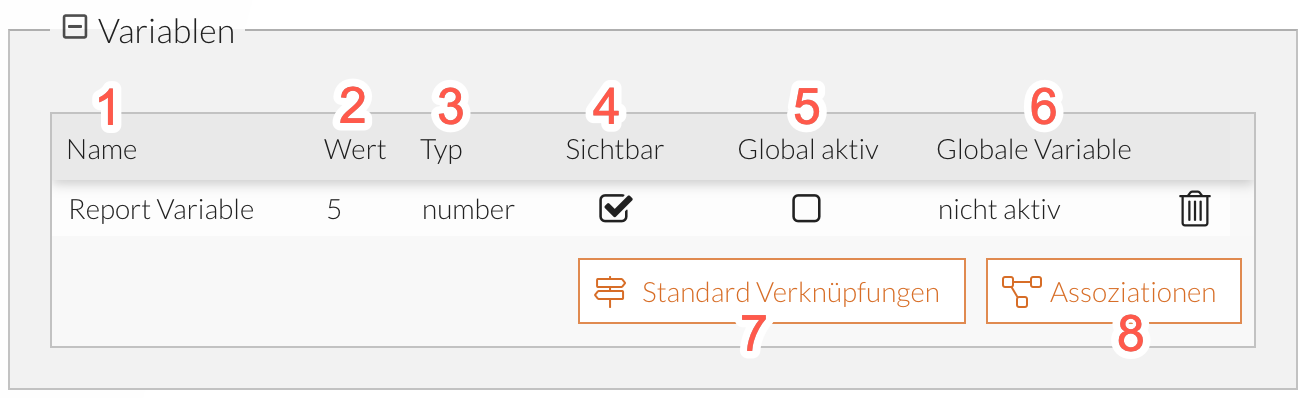
-
Name of the report variable.
The name can be changed directly in the cell by double-clicking. -
Value of the variable.
The value can be changed by clicking in the field or in the Variable Details View. -
Variable type specified during creation in the Variable Details View.
Must be identical to the variable type of the record variable when linking; see Record Editor (cannot be changed). -
Enables/disables access to the variable for consumers.
-
Enables/disables the global link (see Global Variables)
-
When the global link is active, a global variable can be selected by clicking.
-
Each record variable used in the report is linked to exactly one report variable. This report variable is assigned the default value from the associated record variable.
This action resets all user-made changes to the report variables. -
Opens the " Variable Details View." A window opens where user-specific variables can be added and existing report variables can be linked (i.e., associated) with dataset variables.
In addition, the detail view provides a preview of all existing charts with their corresponding data set variables.
Global Variables
Global variables are already available in the BPC context; these include:
| Global Variable | Type | Description |
|---|---|---|
|
Text |
The logged-in user in BPC |
|
Date |
Start value from the "Global Date Range Filter" (see Global Date Filter) |
|
Date |
End value from the "Global Date Range Filter" (see Global Date Filter) |
These variables can be bound to report variables of the same type.
This transfers the value from the global variable to the report variable.
If a global variable is not available, the value set for the report variable is used.
Variable Details View
The details view is divided into two sections:
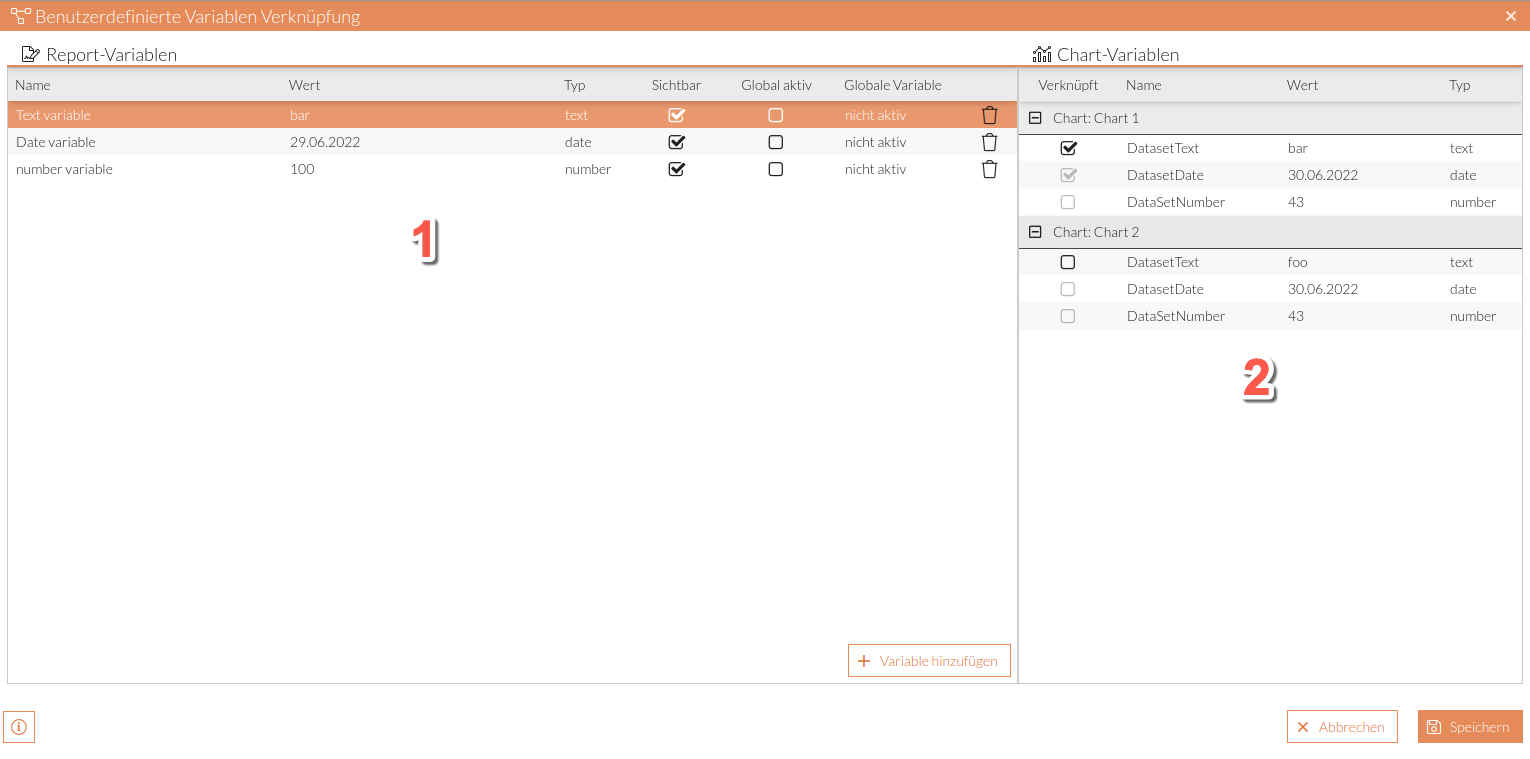
-
List of all report variables
-
List of all charts with their associated data set variables
The variables are grouped by chart
The following information is also displayed:
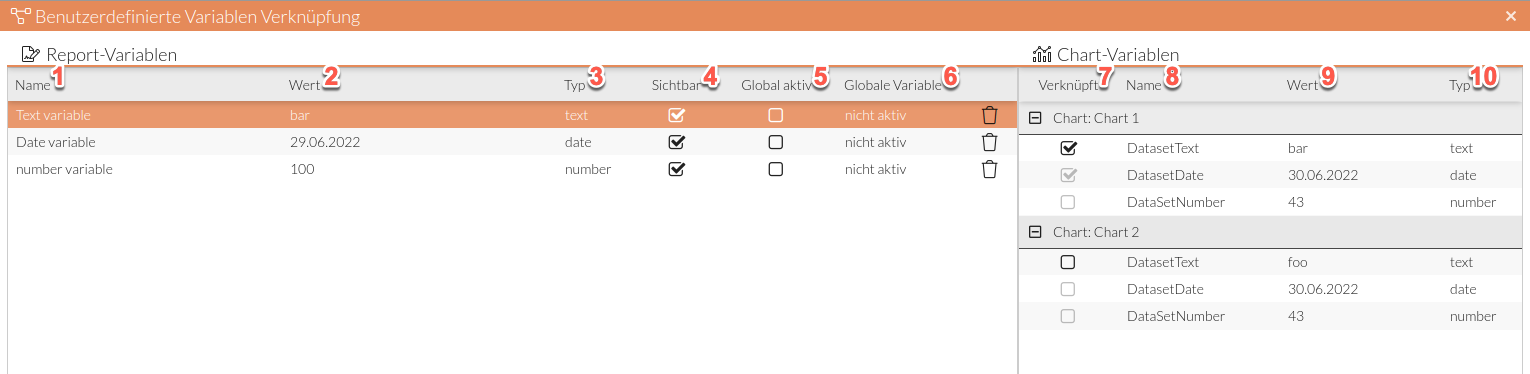
-
Name of the report variable
-
Current value of the report variable
-
Type of the report variable
-
Selection for the visibility of the report variable
-
Option to specify whether the report variable is globally active
-
Information on whether a global variable is active
-
Select to link the record variable to the selected report variable
-
Name of the record variable
-
Value of the record variable
-
Type of the record variable
Add report variable
-
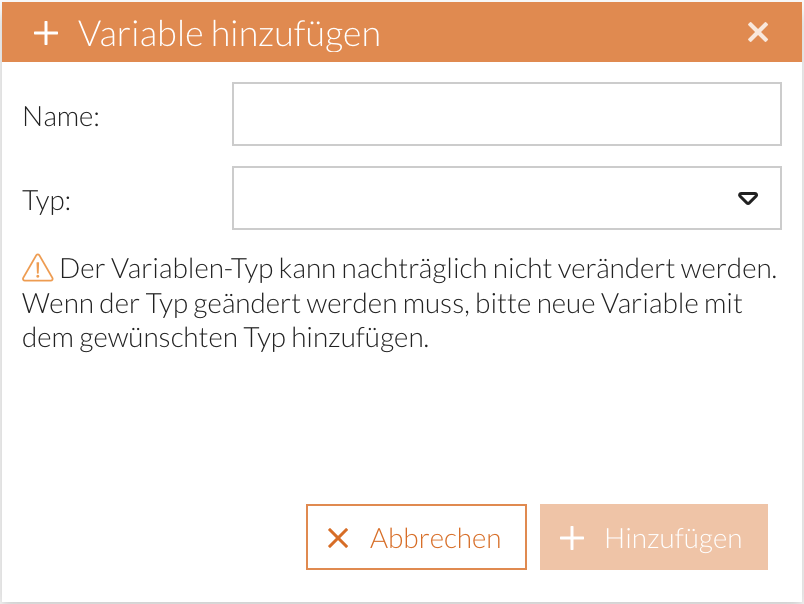
Click Add.
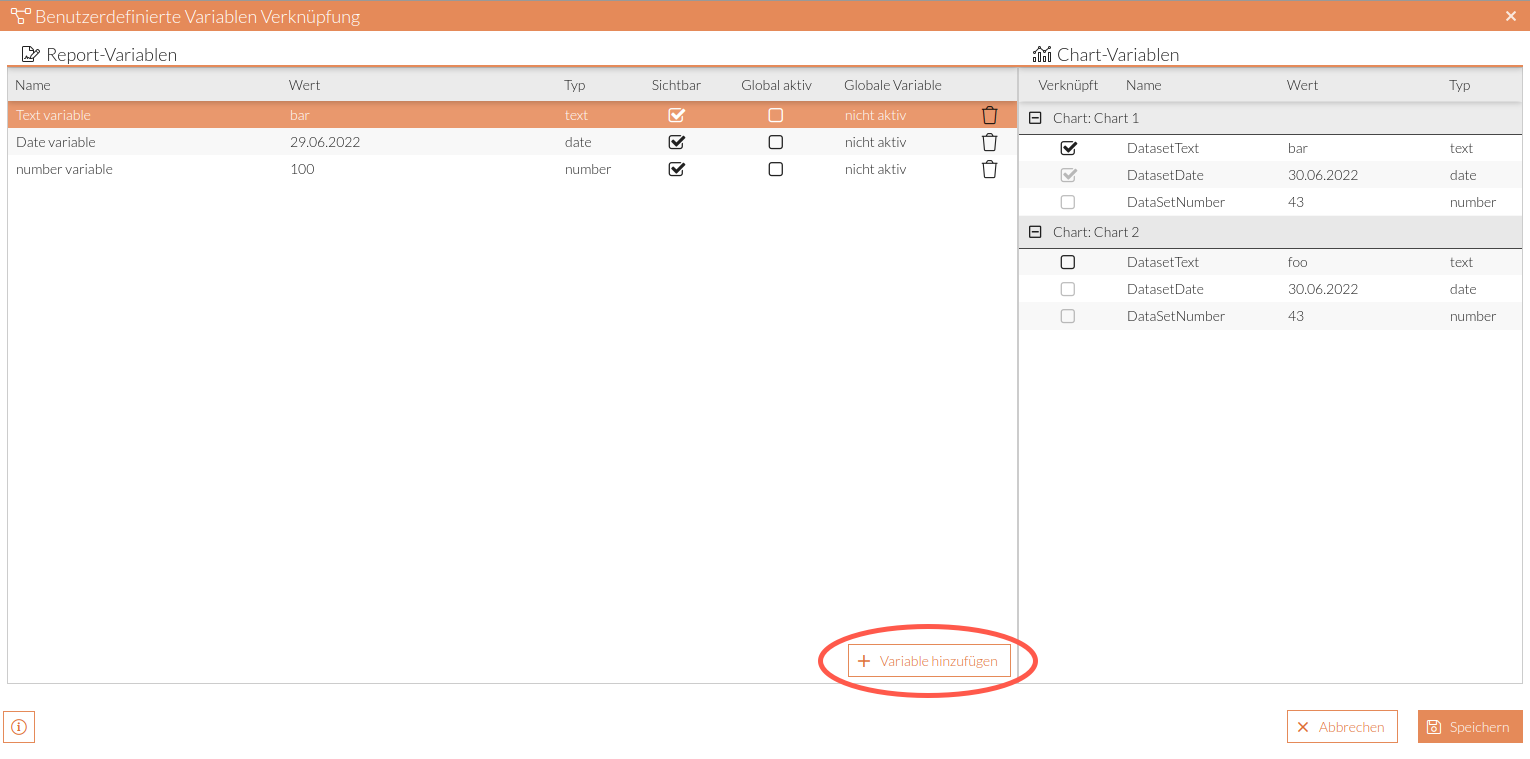
A window opens:
-
Enter a name and select a type.
-
Click "Add."
The variable has been created and appears in the report variables overview.
Associating Report Variables with Record Variables
When associating variables, the following conditions must be observed:
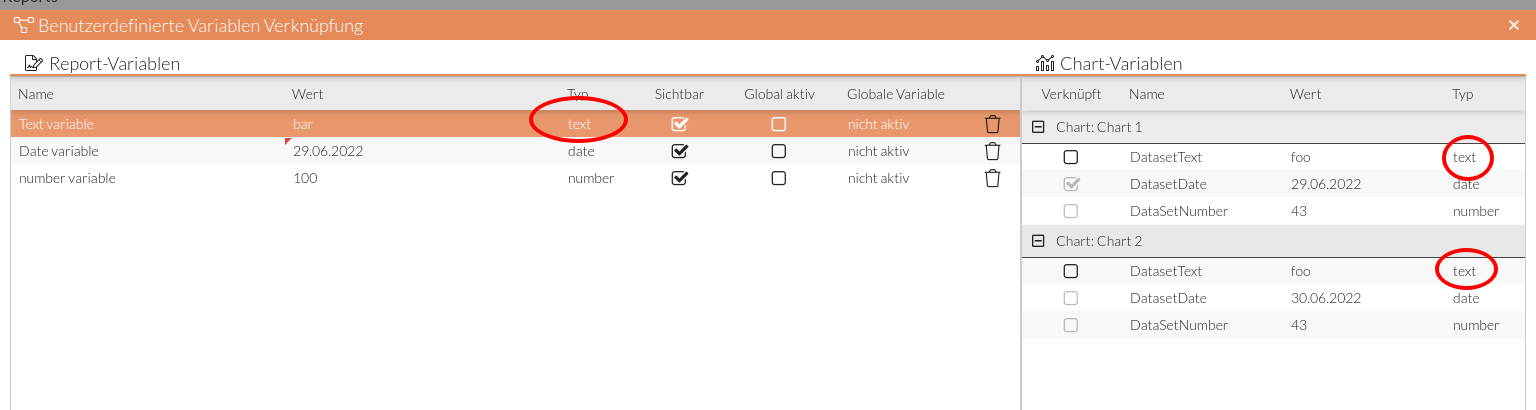
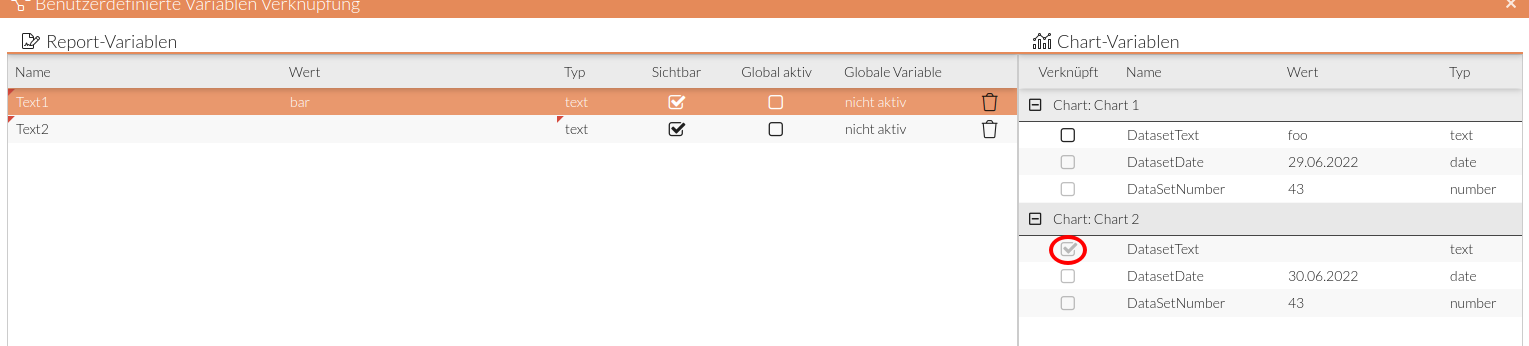
-
The record variable to be linked must have the same type as the selected report variable:
-
The record variable to be linked must not already be linked to other report variables:
-
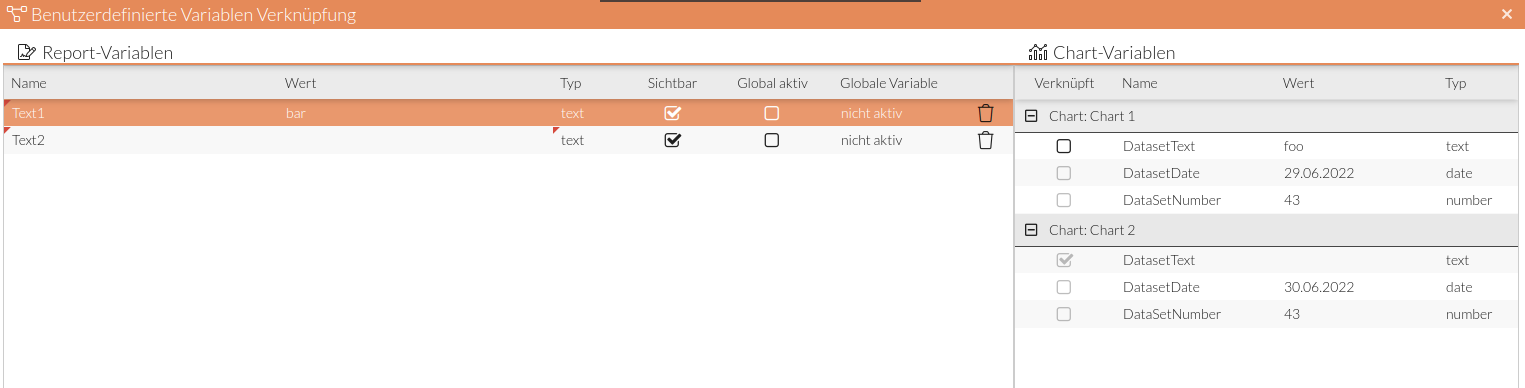
Select the report variable to be linked.
-
Select the record variable whose checkbox is checked (a link is only possible if this is the case):
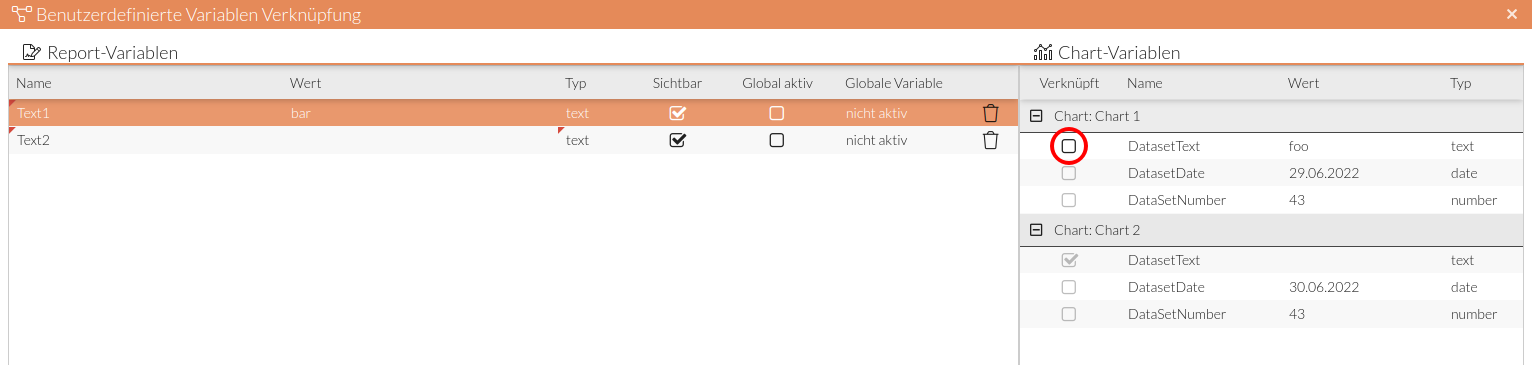
-
Select the checkbox:
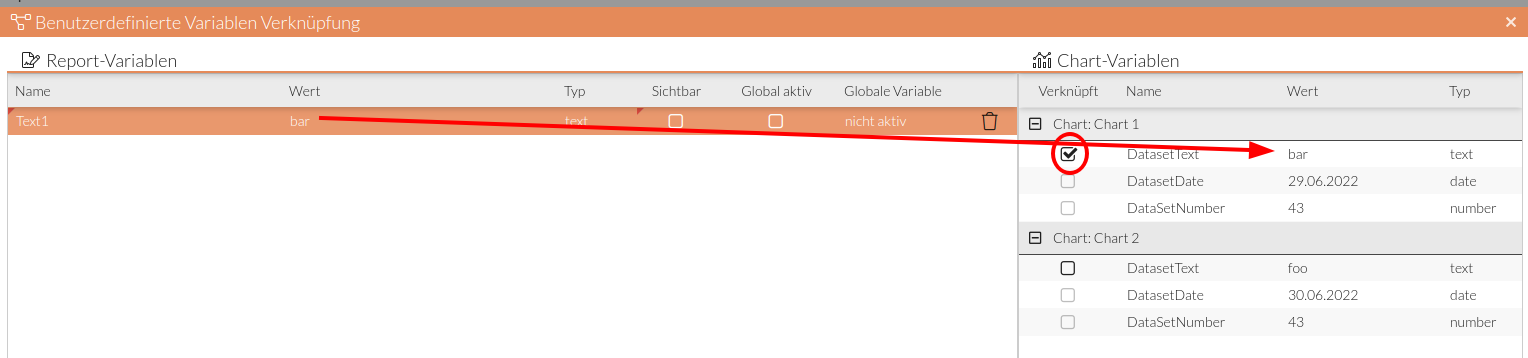
The association is now active, and the value of the report variable is transferred to the record variable.
-
Add additional associations if necessary.
-
Click Save.
The details window closes, and the variable configuration as well as the entire report are saved.
A report variable can be linked to any number of record variables.
If you want to restore the previous report configuration, click Cancel.
Access Rights for Consumers
Here you can restrict access rights to reports for report consumers. The "Rights/Roles/Organizations" principle is used for this; see Mapping of Organizations, Roles, and Permissions.
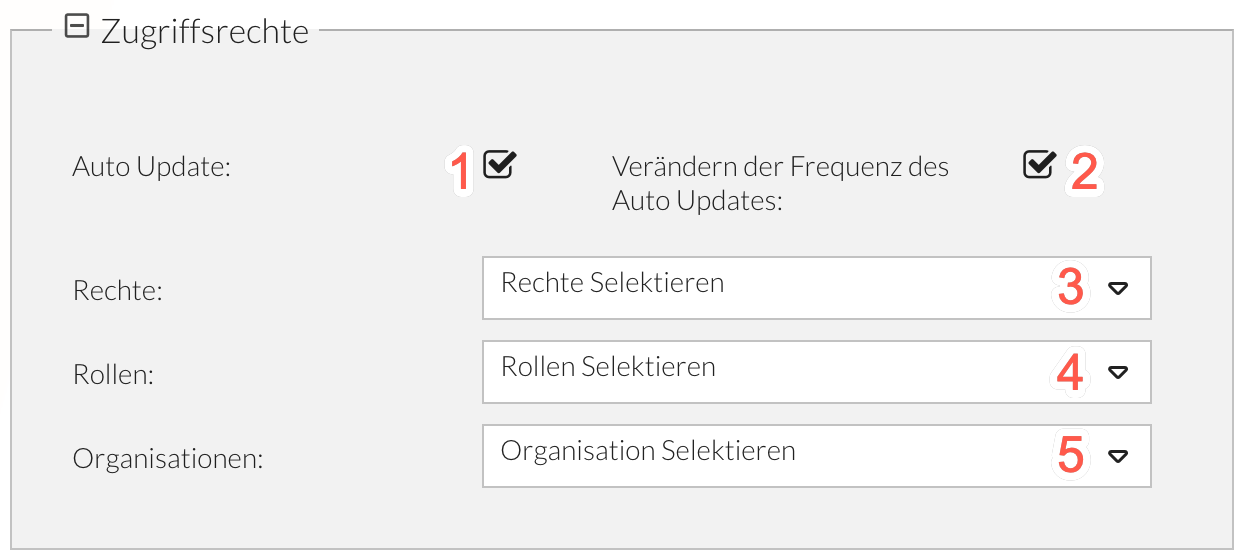
-
Allows consumers to enable or disable automatic report refresh.
-
Allows consumers to adjust the frequency of automatic refresh.
-
Enter the permission name or (if available) select an entry from the drop-down list.
-
Enter the role name or (if available) select an entry from the drop-down list.
-
Enter the organization name or (if available) select an entry from the drop-down list.
Save the settings.
You can now continue in the " Catalog Editor."
