User interface
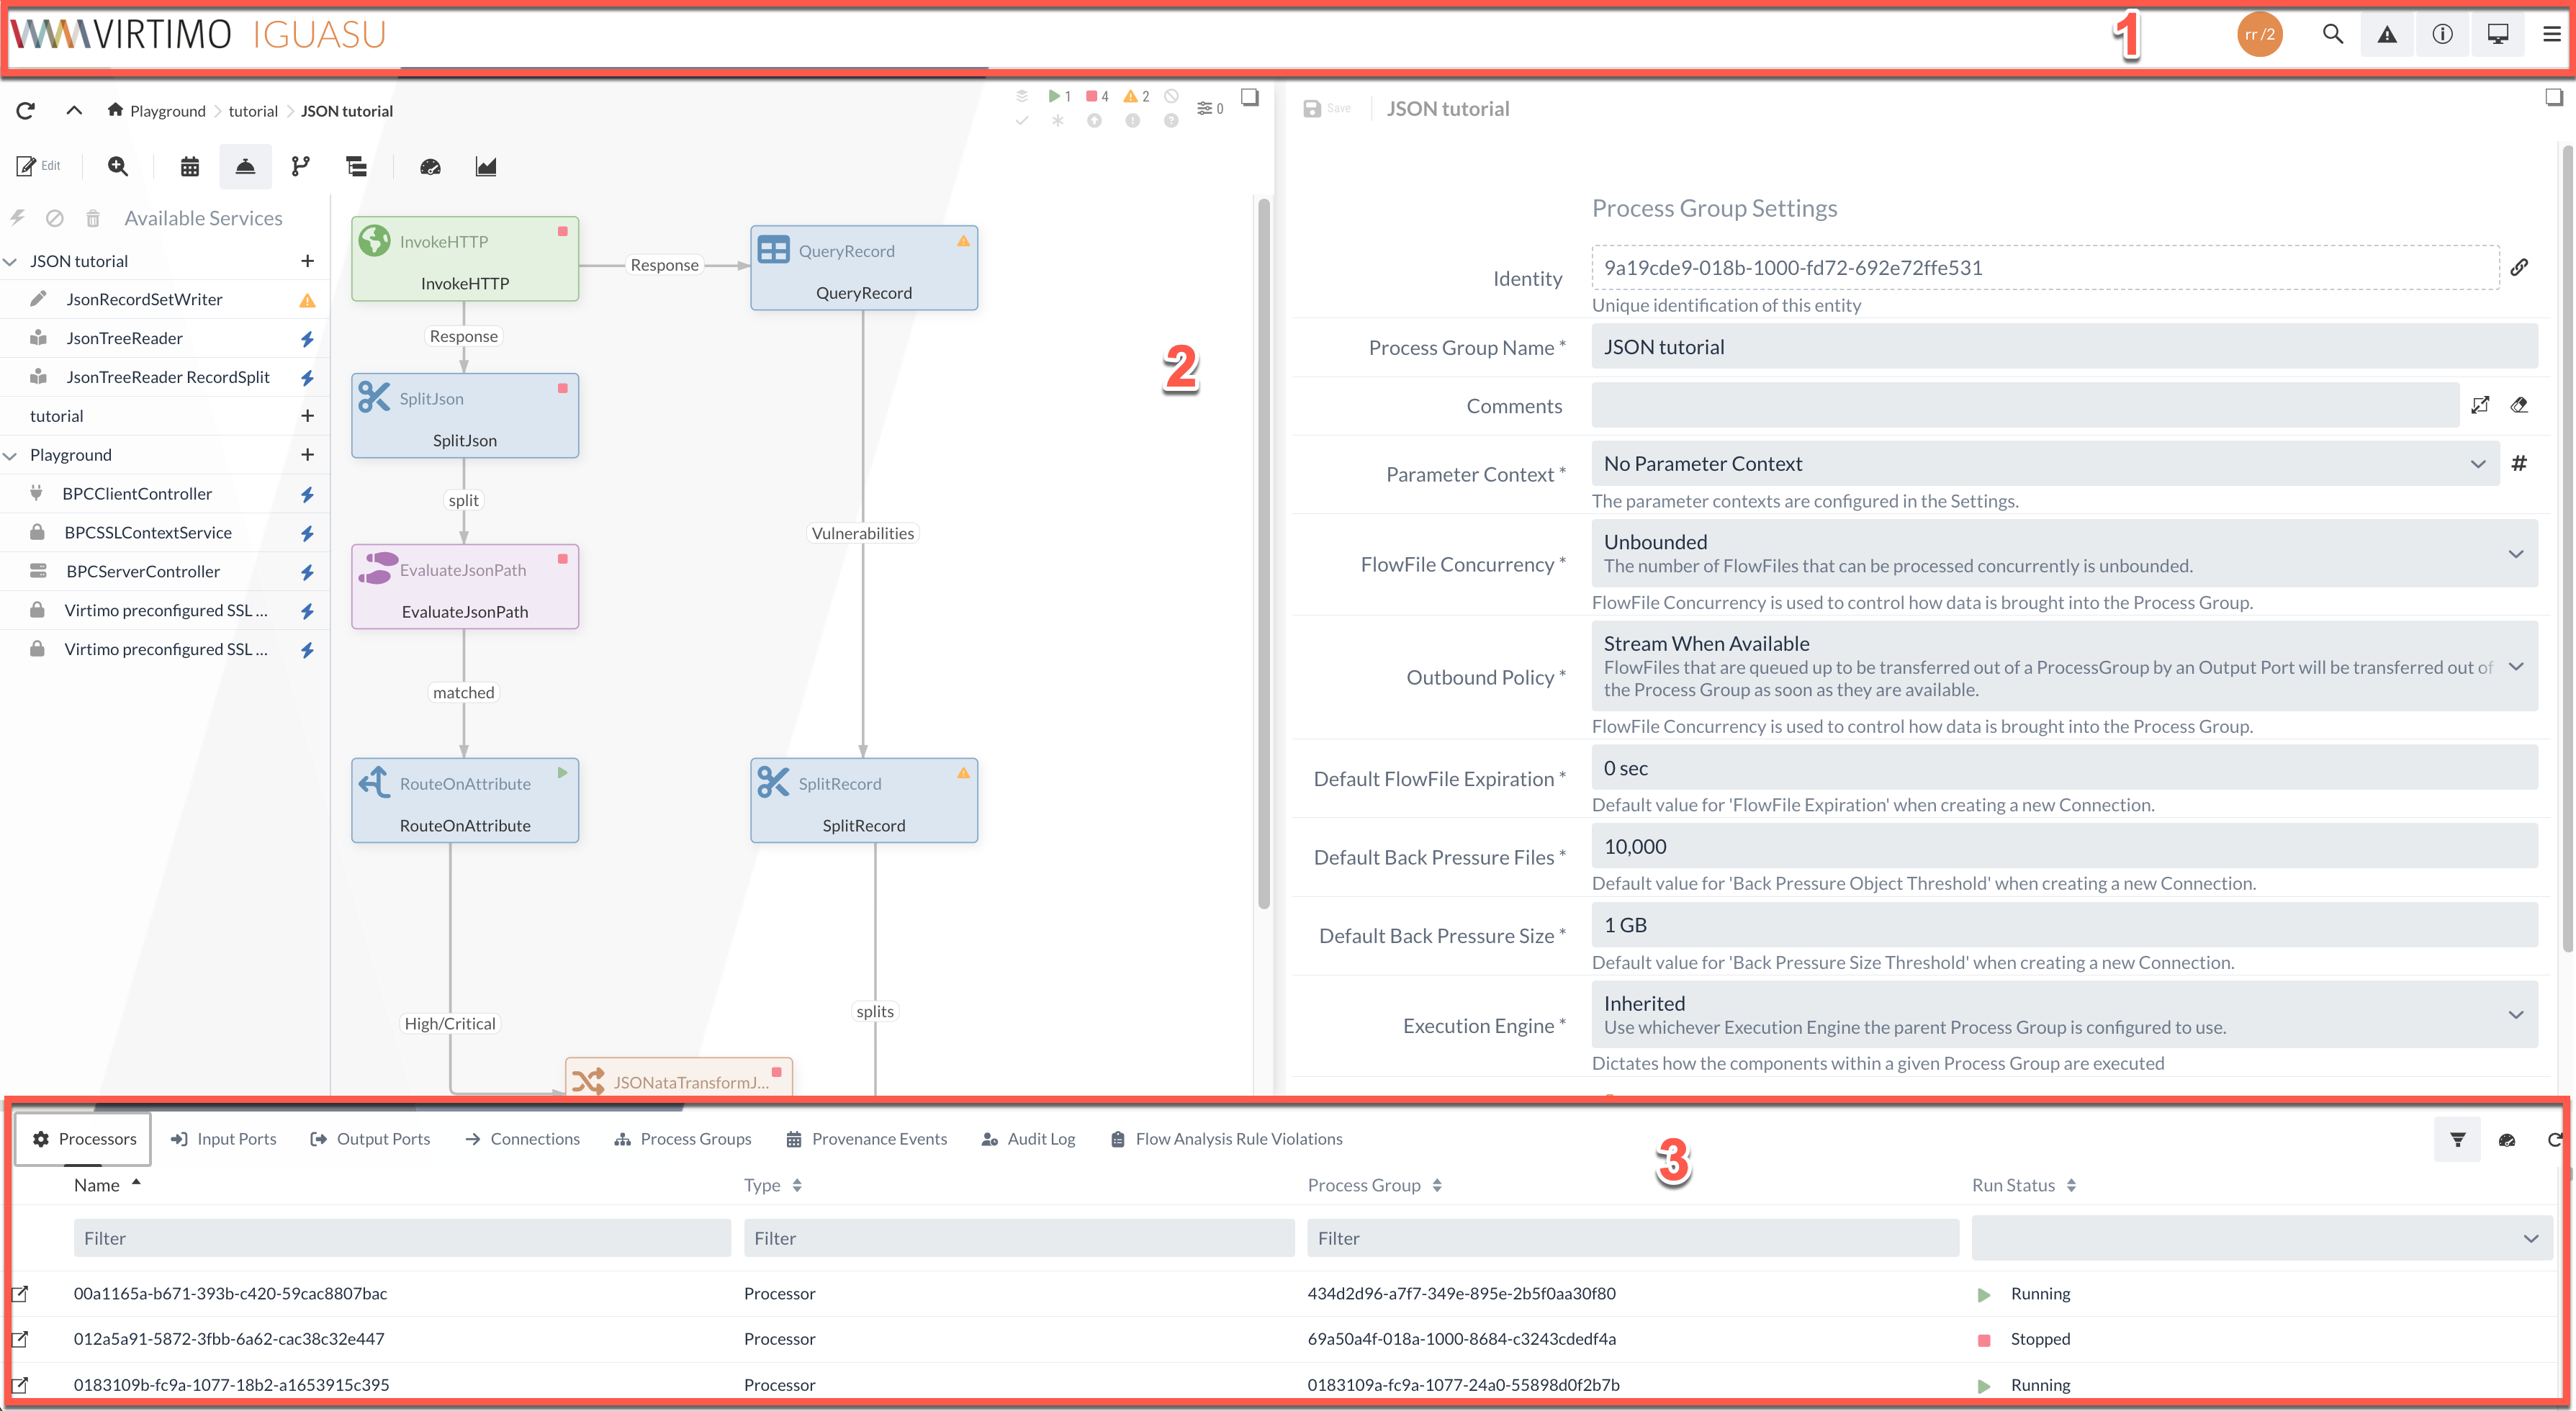
Global toolbar
The global toolbar contains various function icons, buttons and menus, which are explained in the following table
Opens the global search for all existing model components in the application, e.g. Process Groups, Processors or Services |
|
Shows/hides warning messages, if available |
|
Shows/hides additional information on the setting options |
|
Opens the overview of all existing Processors, Ports, connections, Process Groups and data flows |
|
Opens the global menu with links to notifications, system information, general settings and documentation. |
Global menu
The global menu can be accessed via the icon at the top right of the application.
Various options are available in this menu to view information about the application or to adapt it to your own requirements. This section of the documentation describes the various possibilities and options that are available.
General view
The application is divided into two areas below the navigation bar:
On the left-hand side is Diagram, where the created data flows can be visualized and edited.
On the right-hand side, selected elements in Configuration area can be customized.
In principle, all buttons and configuration options have tooltips or descriptions for support. Selected buttons are highlighted in grey in all areas of the application when they are selected.
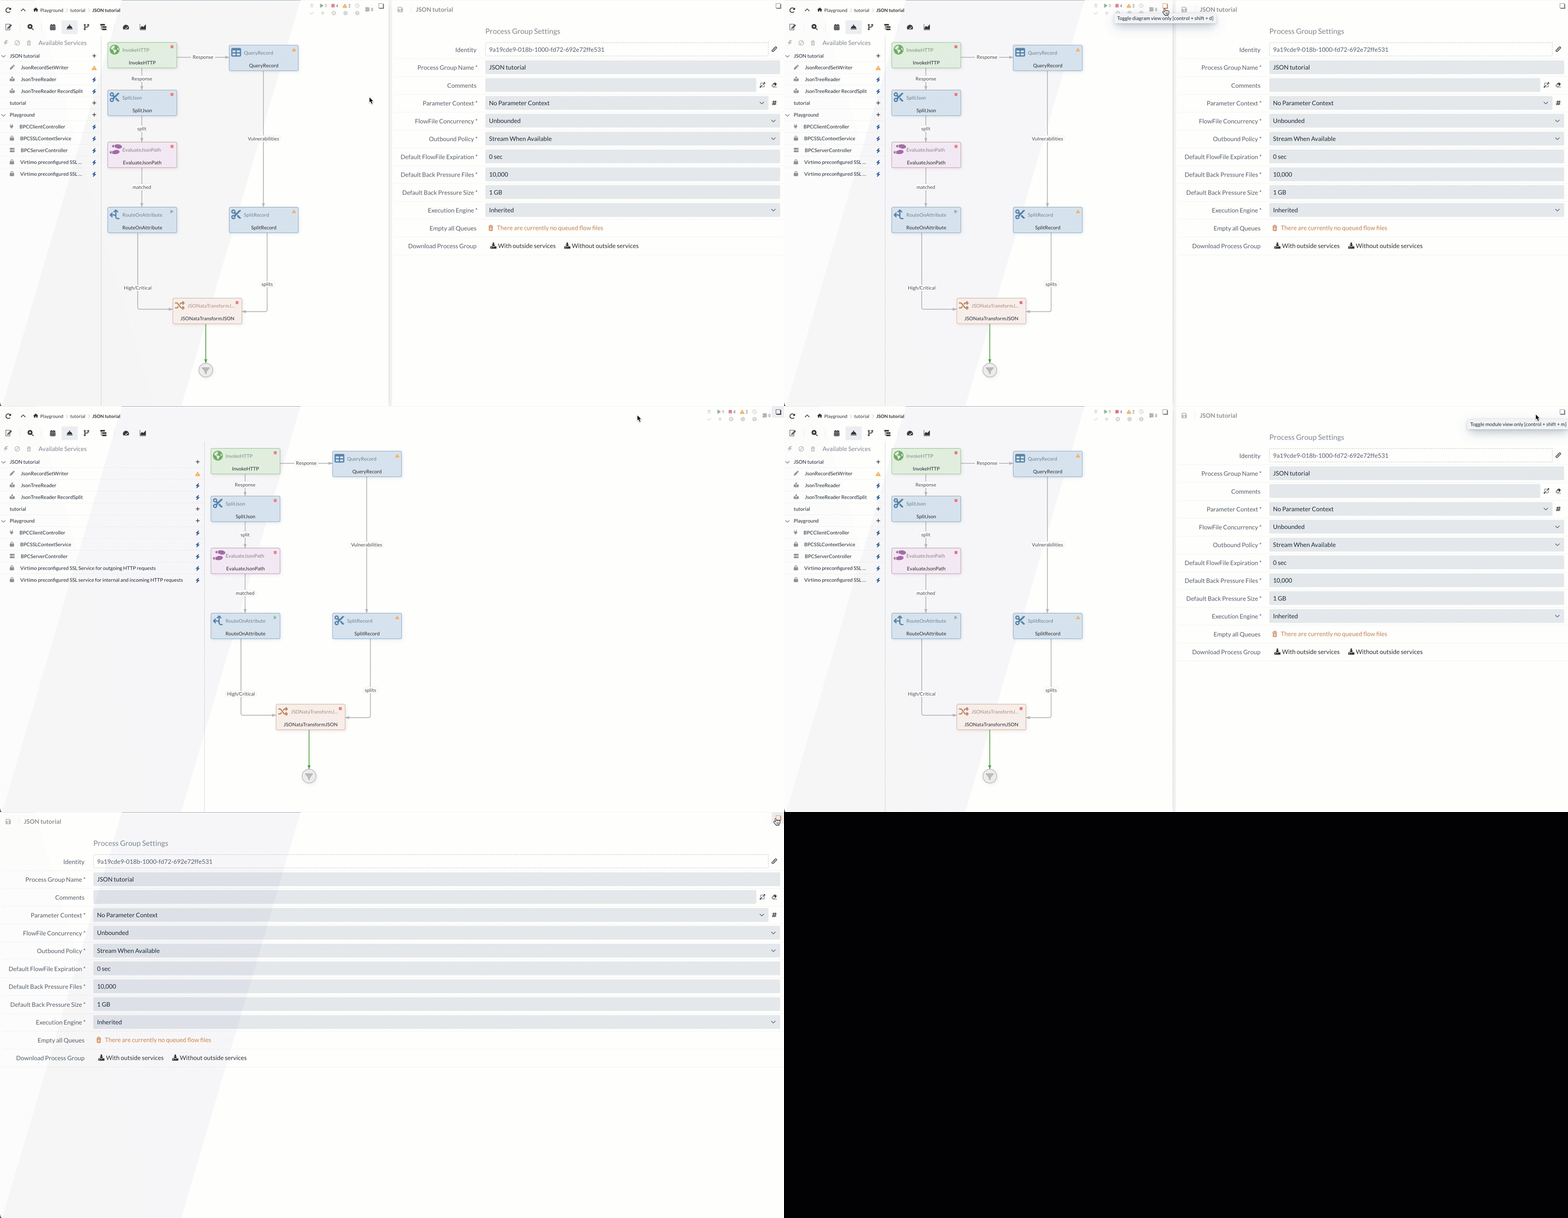
In addition, all displayed windows can be shown or hidden using the square icon at the top right-hand end so that the user interface can be adapted to requirements.

An interactive demonstration of this application content with a brief description can be accessed via the Welcome Tour in the global menu.
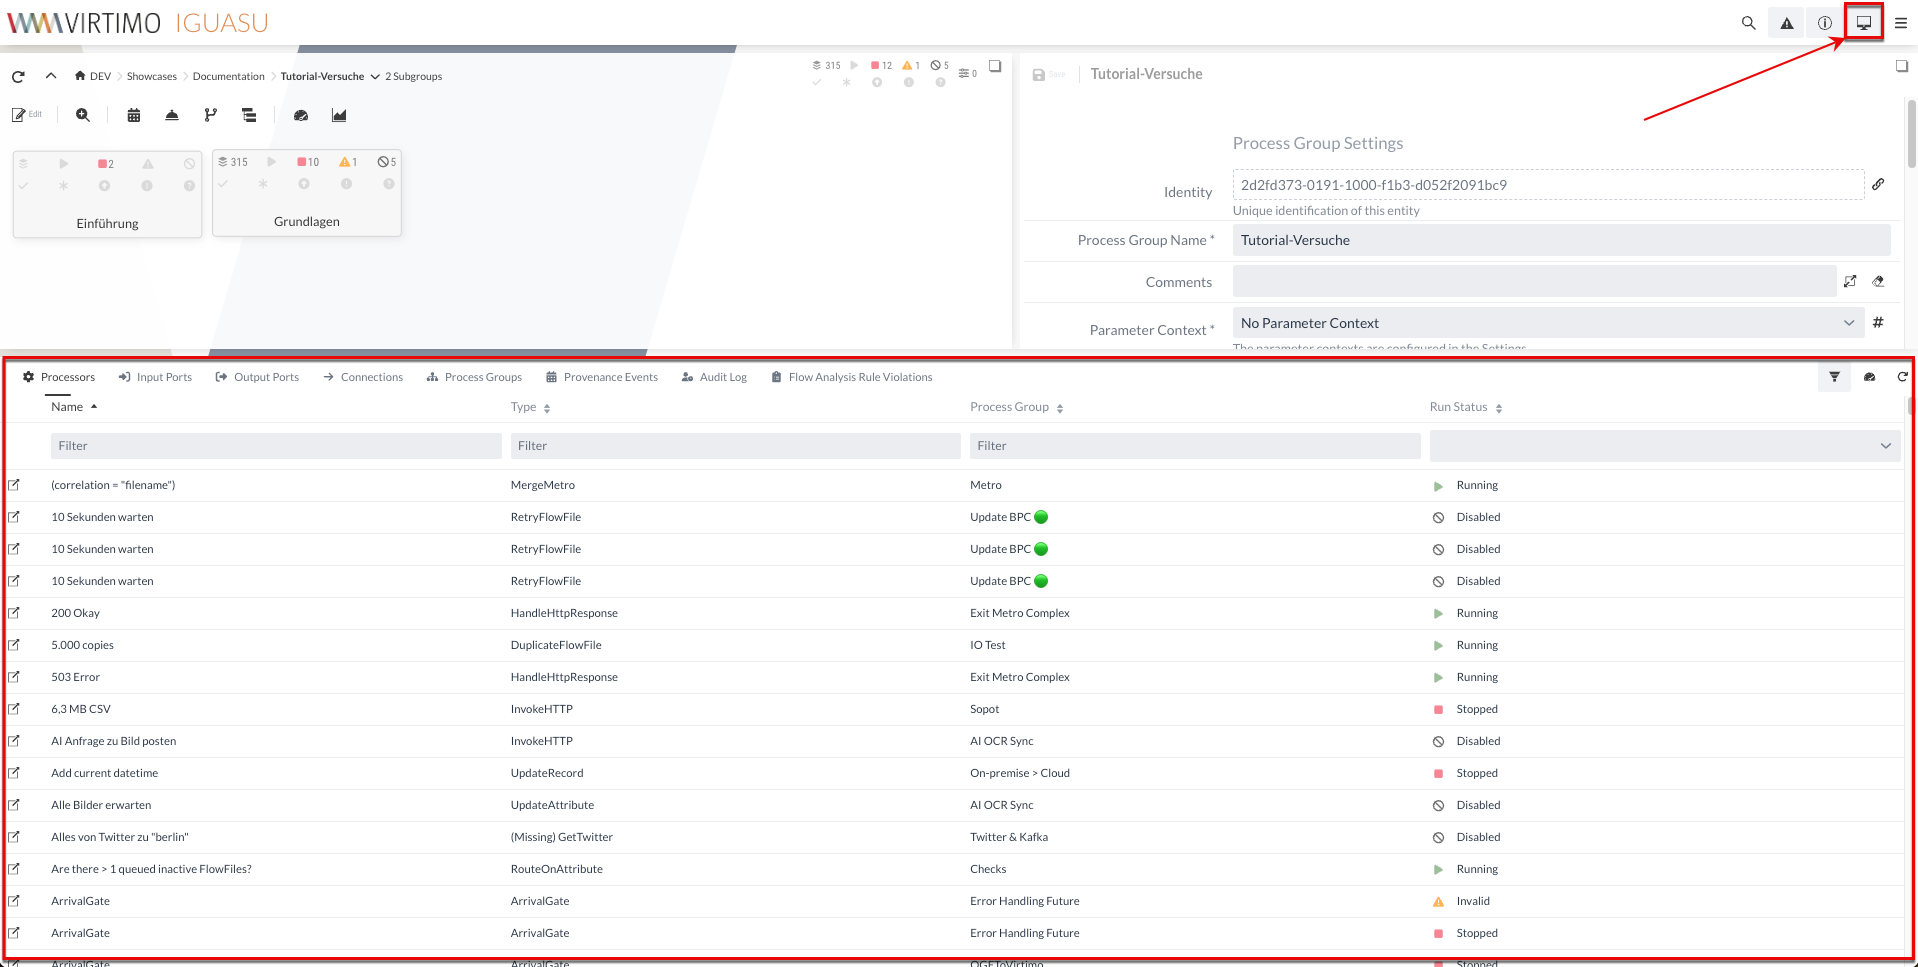
Monitoring Panel
The Monitoring Panel provides an overview of e.g. component types, information on flows, logs, events and rule violations.
See also Monitoring & History.

Teamwork
The global toolbar shows which people are logged into IGUASU. The orange icon represents the user’s own user. Other users are marked with different colors.

Users with the appropriate rights can click on their own icon and jump directly to the Process Group of the desired user via the selection.

Within a Process Group, all users who have opened the same Process Group are displayed above the diagram.
Production mode
In general, a distinction is made between development and production mode. The production mode can be distinguished by the colored background of the global menu.

While changes to running Processors are possible in development mode, no configuration can be carried out on running elements in production mode. In this case, the options displayed in Configuration area are greyed out. This is to ensure that ongoing operation is not affected by changes.

