Diagram
General overview
The Diagram is the interface in the Virtimo IGUASU application on which the data flows are displayed.
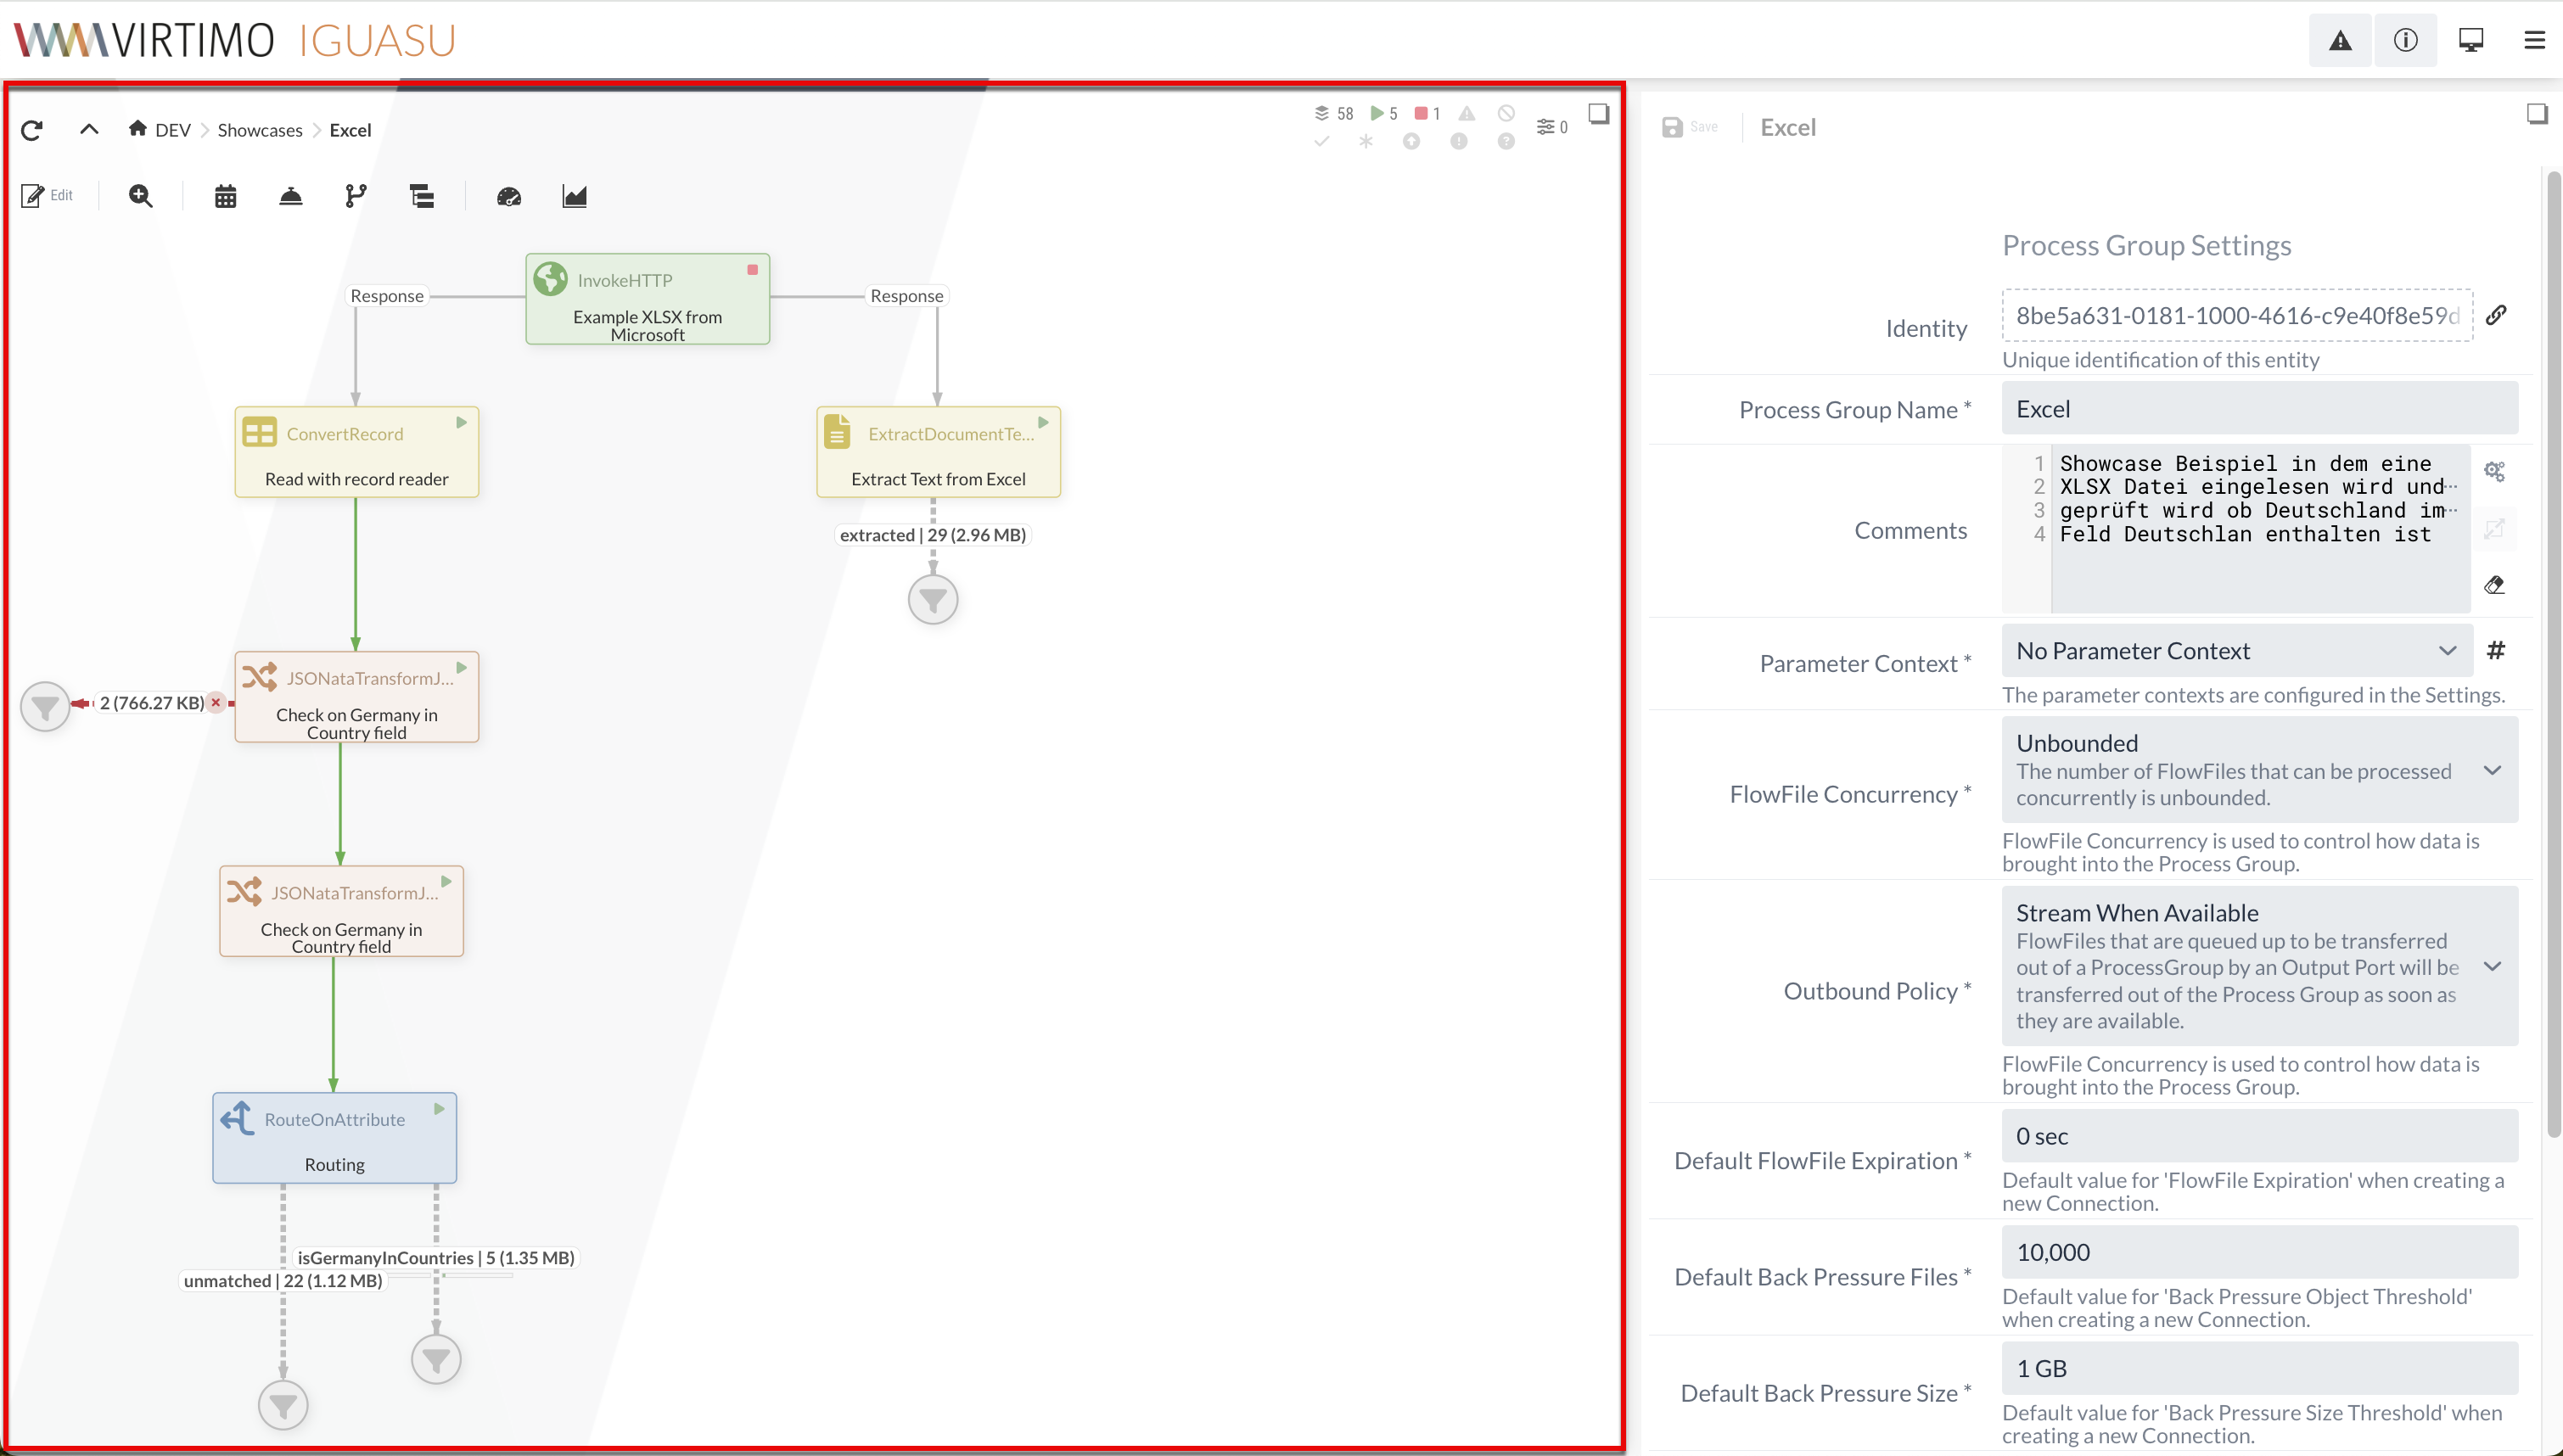
If elements are selected in the Diagram, they can also be customized in Configuration area.
A context menu with suitable actions can be accessed by right-clicking the mouse.
However, Keyboard shortcuts can also be used to access the various functions.
Header
The header is located at the top of the Diagram and contains a navigation bar, a toolbar and a summary of the states of the Processors states.
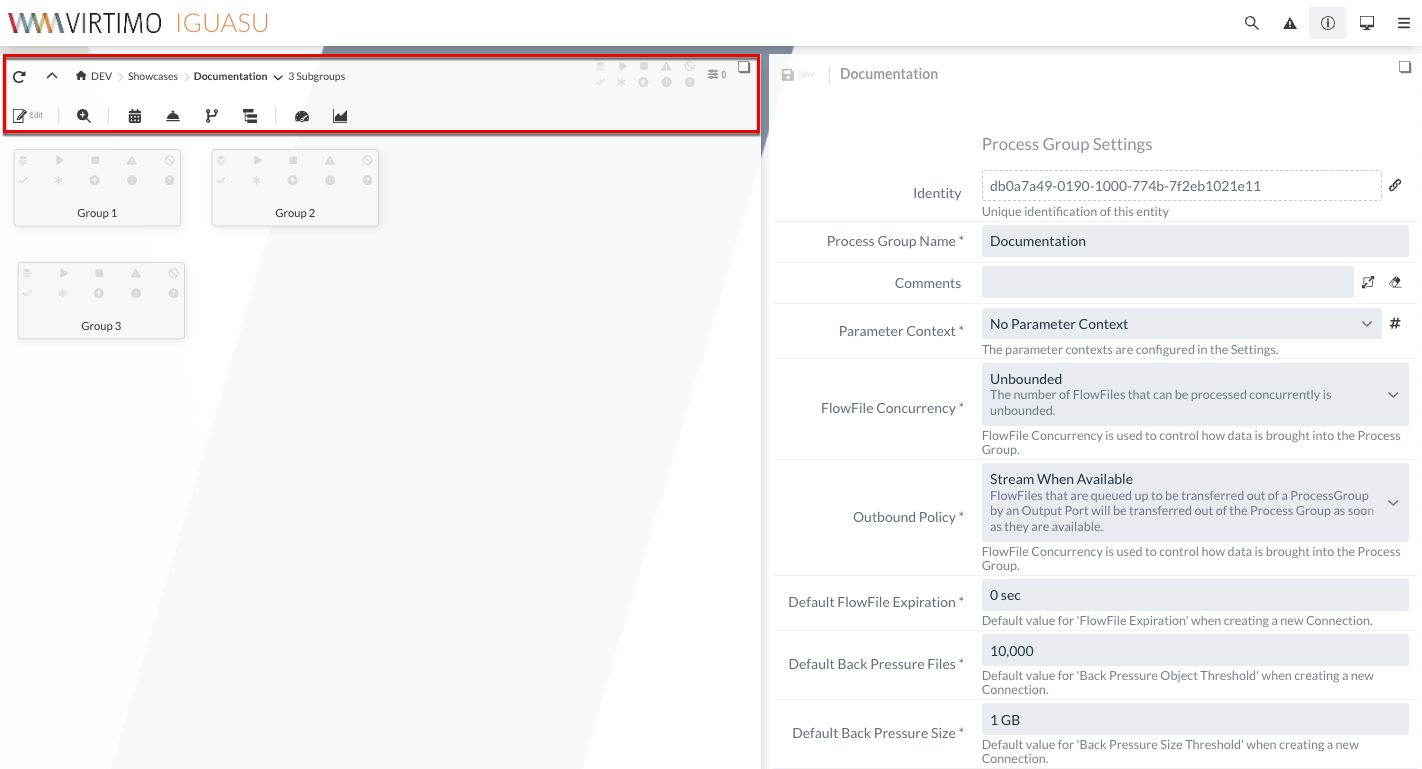
Navigation bar
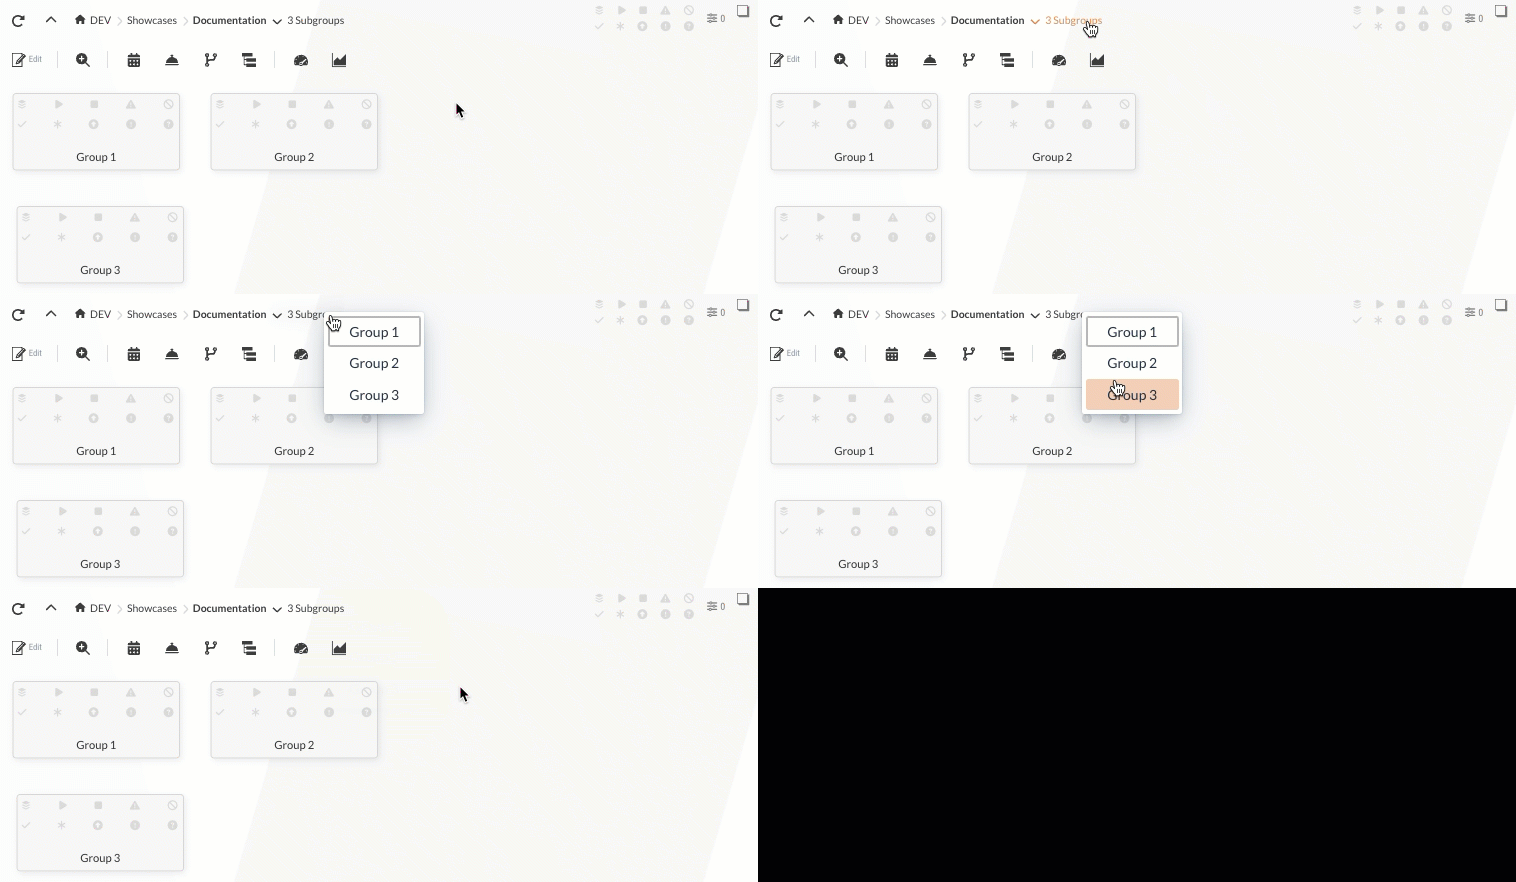
The navigation bar can be used to switch between the created Process Groups created.

If the currently selected Process Group is currently selected, a drop-down menu is also available for selecting the subordinate Process Groups (subgroups).
The icon takes you immediately back to the root Process Group.
Processor states
The summary of the states of existing Processor in the current Process Group.

Further information on this can be found at States of the Processors.
View mode
In view mode, interaction in the Diagram is basically limited to selecting elements. However, it is still possible to make settings for the selected elements in the configuration area or to execute flows.
The following table shows the functions of the toolbar:
| Icon | Description |
|---|---|
|
Switches between View mode and Edit mode. |
|
Allows you to change the size of the elements displayed in the Diagram |
|
Shows the Event table |
|
Opens a window with all Services |
|
Opens the window of the Versioning of the current Process Group |
|
Opens the window of the Flow trees on the left-hand side. This can be used to switch between existing Process Groups |
|
Shows the Processing statistics for the Processors and Process Groups created |
|
Opens the window of the History of the current Process Group. |
Event table
Events are generated by the Processors during the executions to display various actions related to the content or attributes.
The event table contains information on the provenance (past executions) of selected Processors. The corresponding button can be used to show and hide the event table:
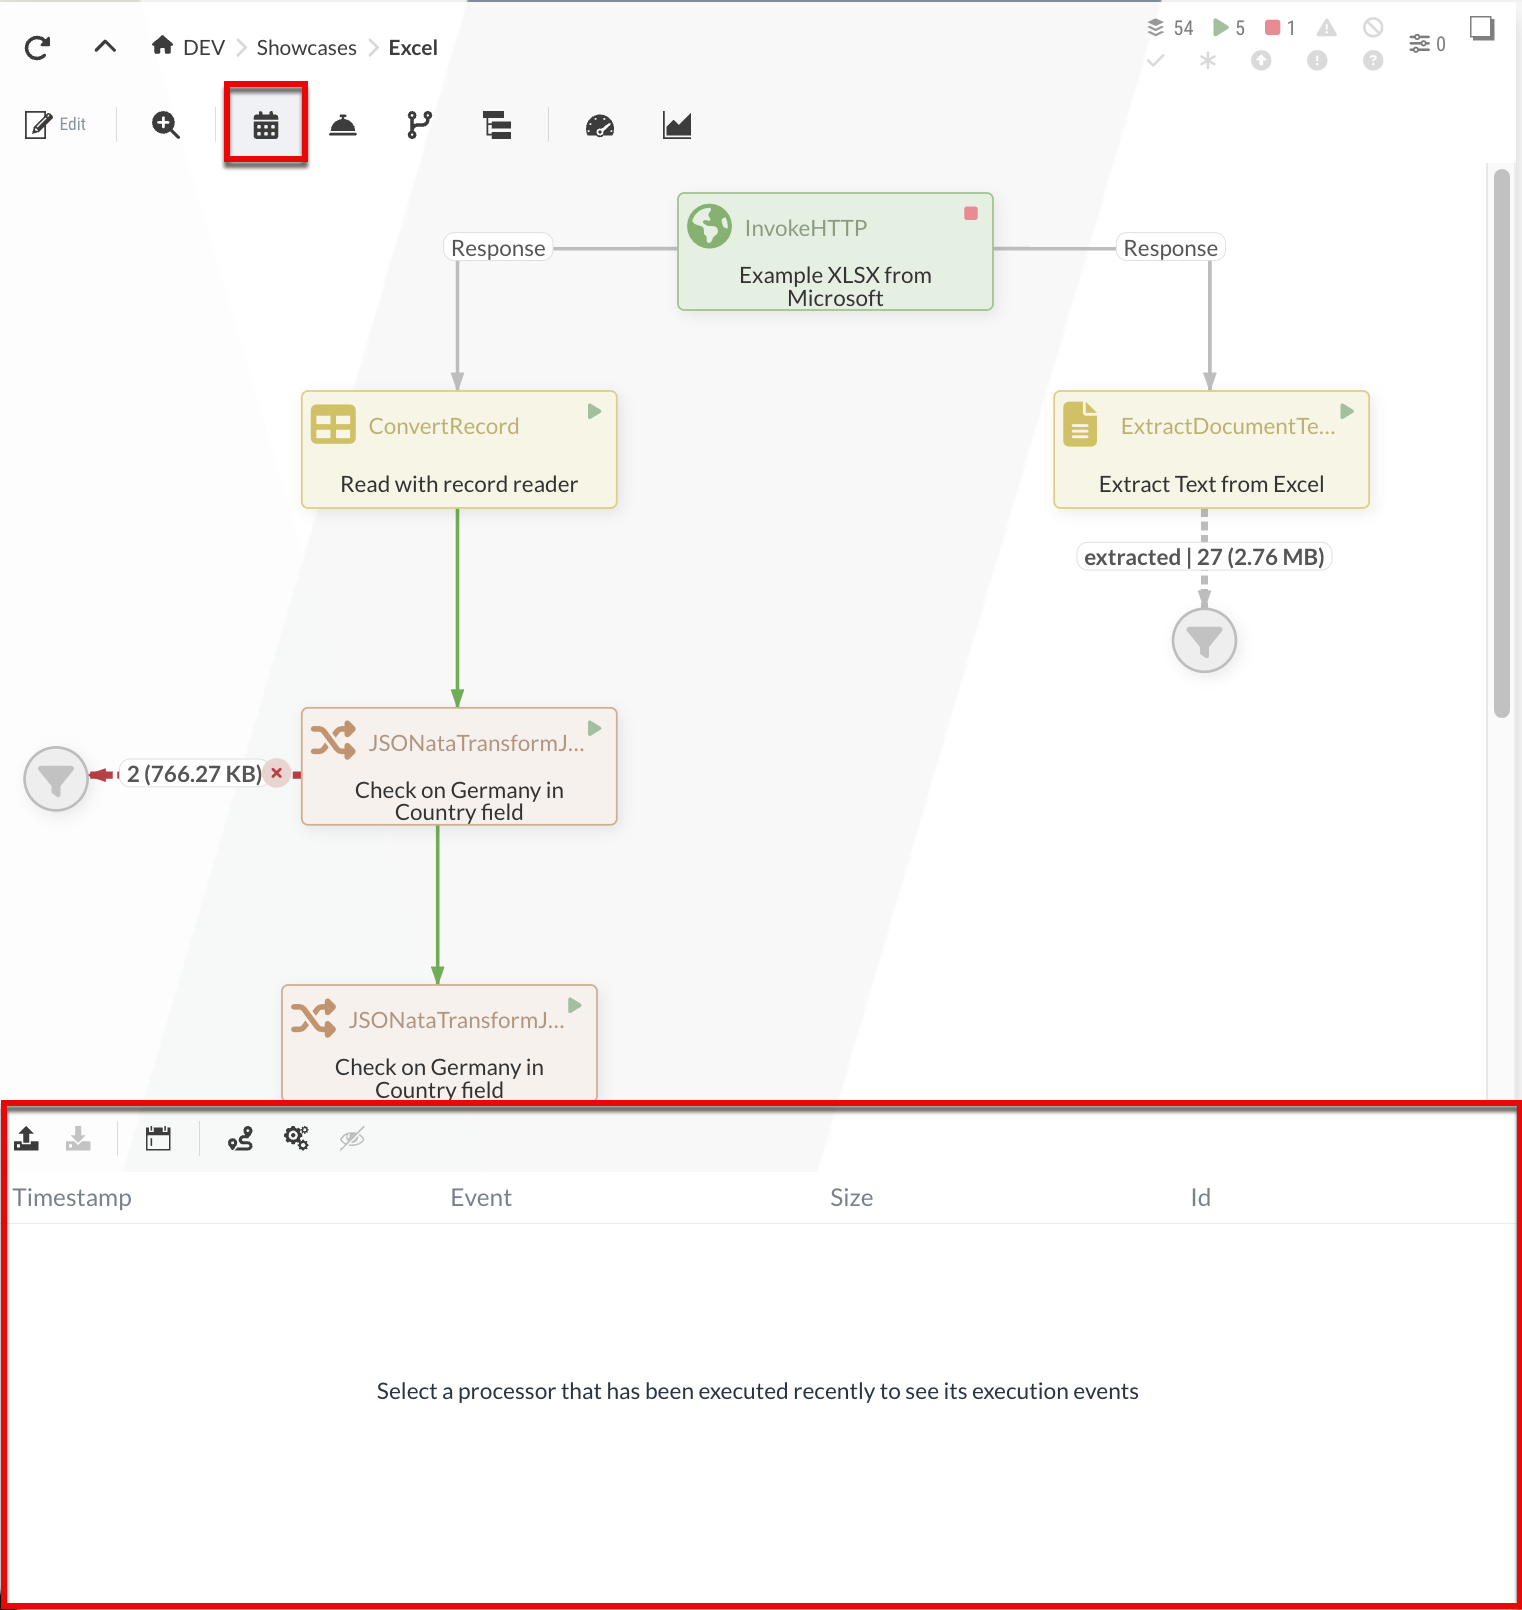
If no Processor has been selected or the selected Processor has no events, this table is initially empty. If there is content, information regarding the execution time, the size of the processed data, the ID of the process and the event type is displayed.
Toolbar of the event table
| Icon | Description |
|---|---|
|
Can be used to re-import previously downloaded events into Event table. This may be necessary, for example, to reproduce certain results or to continue the application even if external systems are no longer available |
|
Allows you to download a selected event from Event table |
|
Filter event table according to specific time periods |
|
Highlights the entire execution sequence of the selected event in the Diagram. The Processor that generated the event is highlighted in blue |
|
Further filter options for events such as max. events, loading time, events per component or children |
|
Events that are not selected are hidden. |
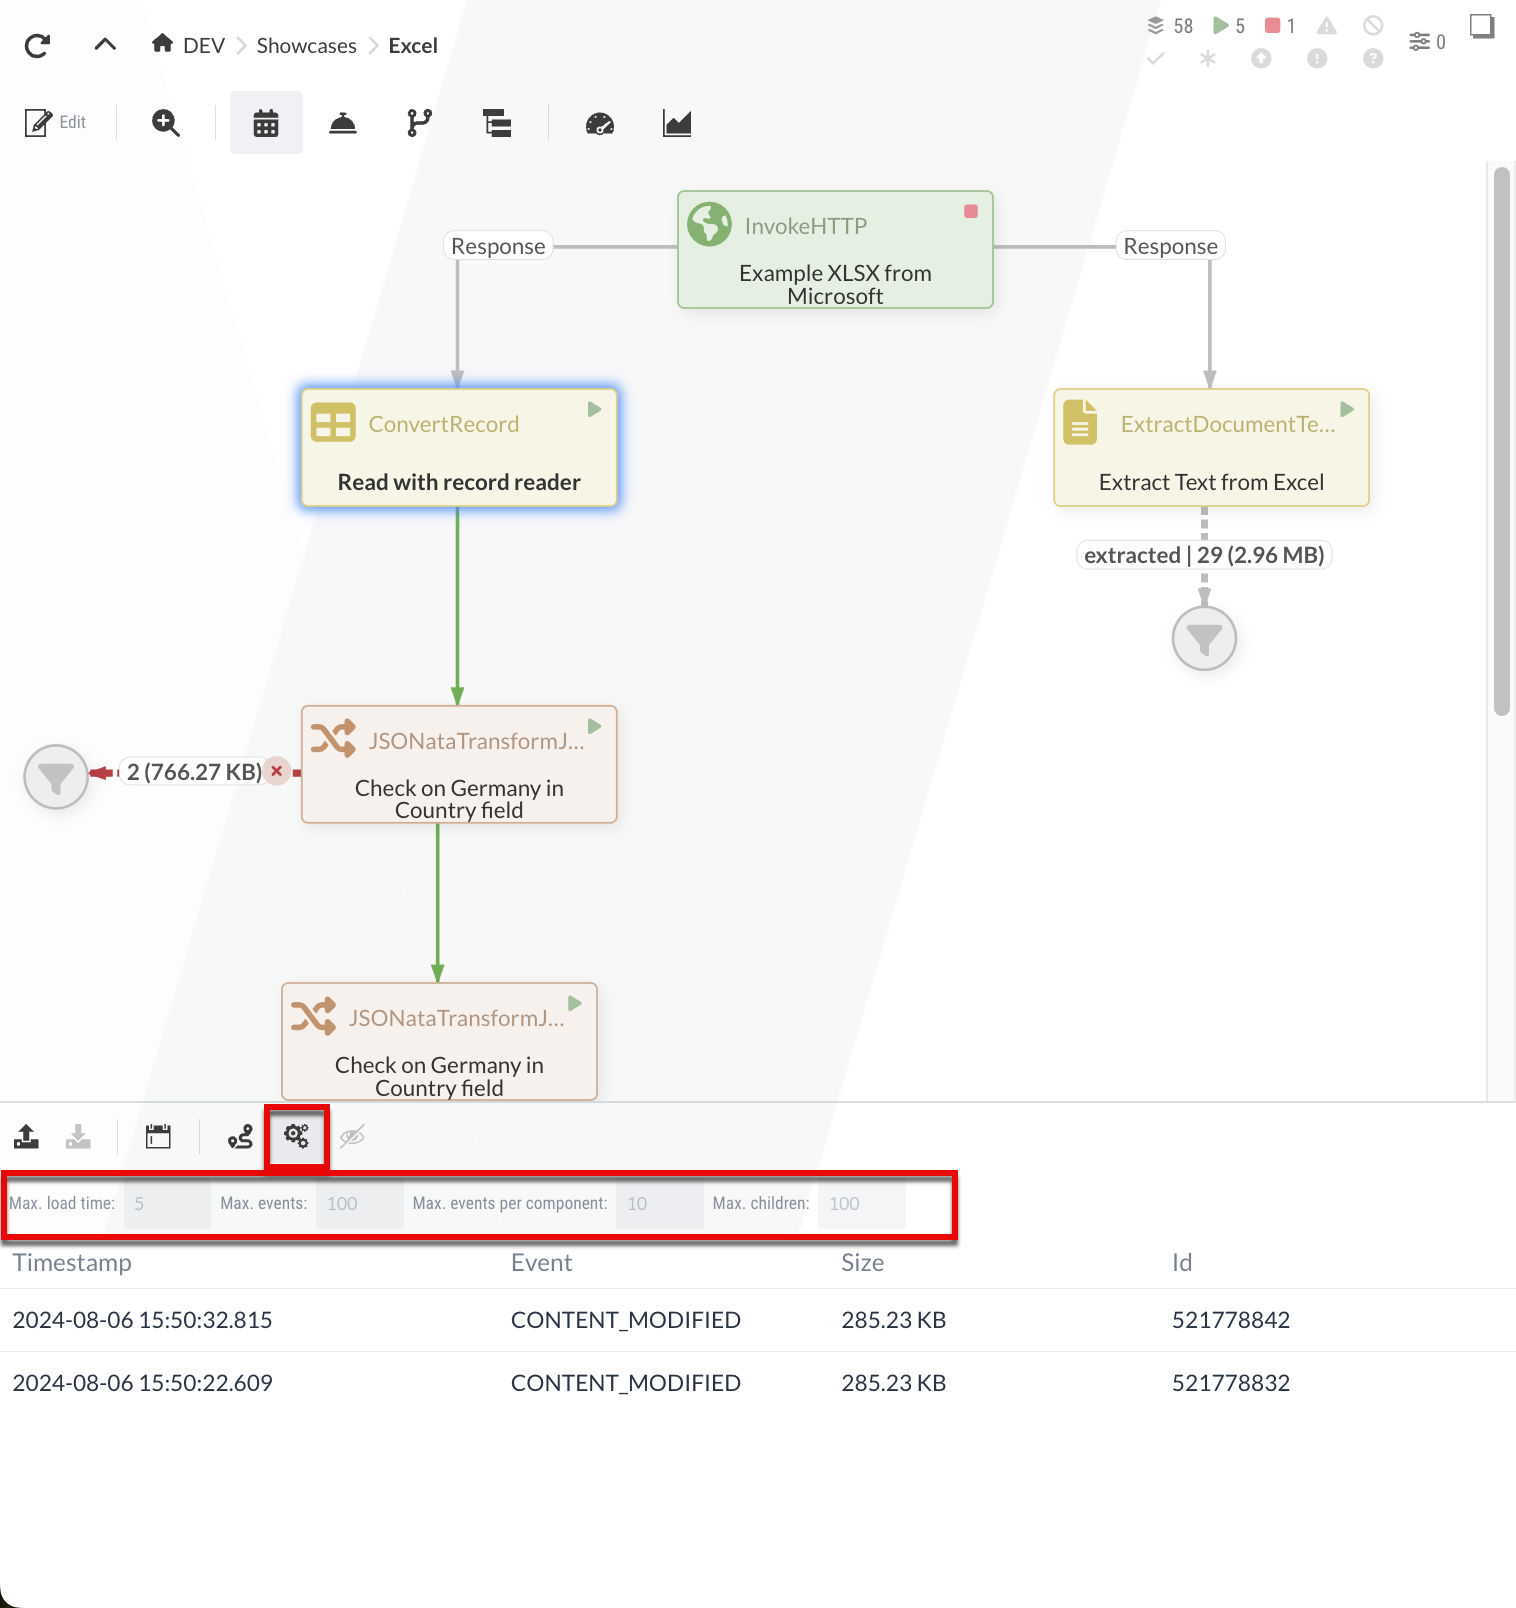
Some functions can be configured in the event table, e.g. automatic determination of the entire execution route or the time used for this.
To open these settings, an additional toolbar can be shown and hidden within the event table:
Evaluation of events
If you now select one of the executions in the event table,
-
an attempt is made to determine the entire execution route for this instance with all the Processors involved,
-
the complete execution of the flow is highlighted in color in the Diagram,
-
the events associated with the execution of this Processor are highlighted in the table,
-
the data that was consumed or generated by the Processor for this event is displayed on the right-hand side.
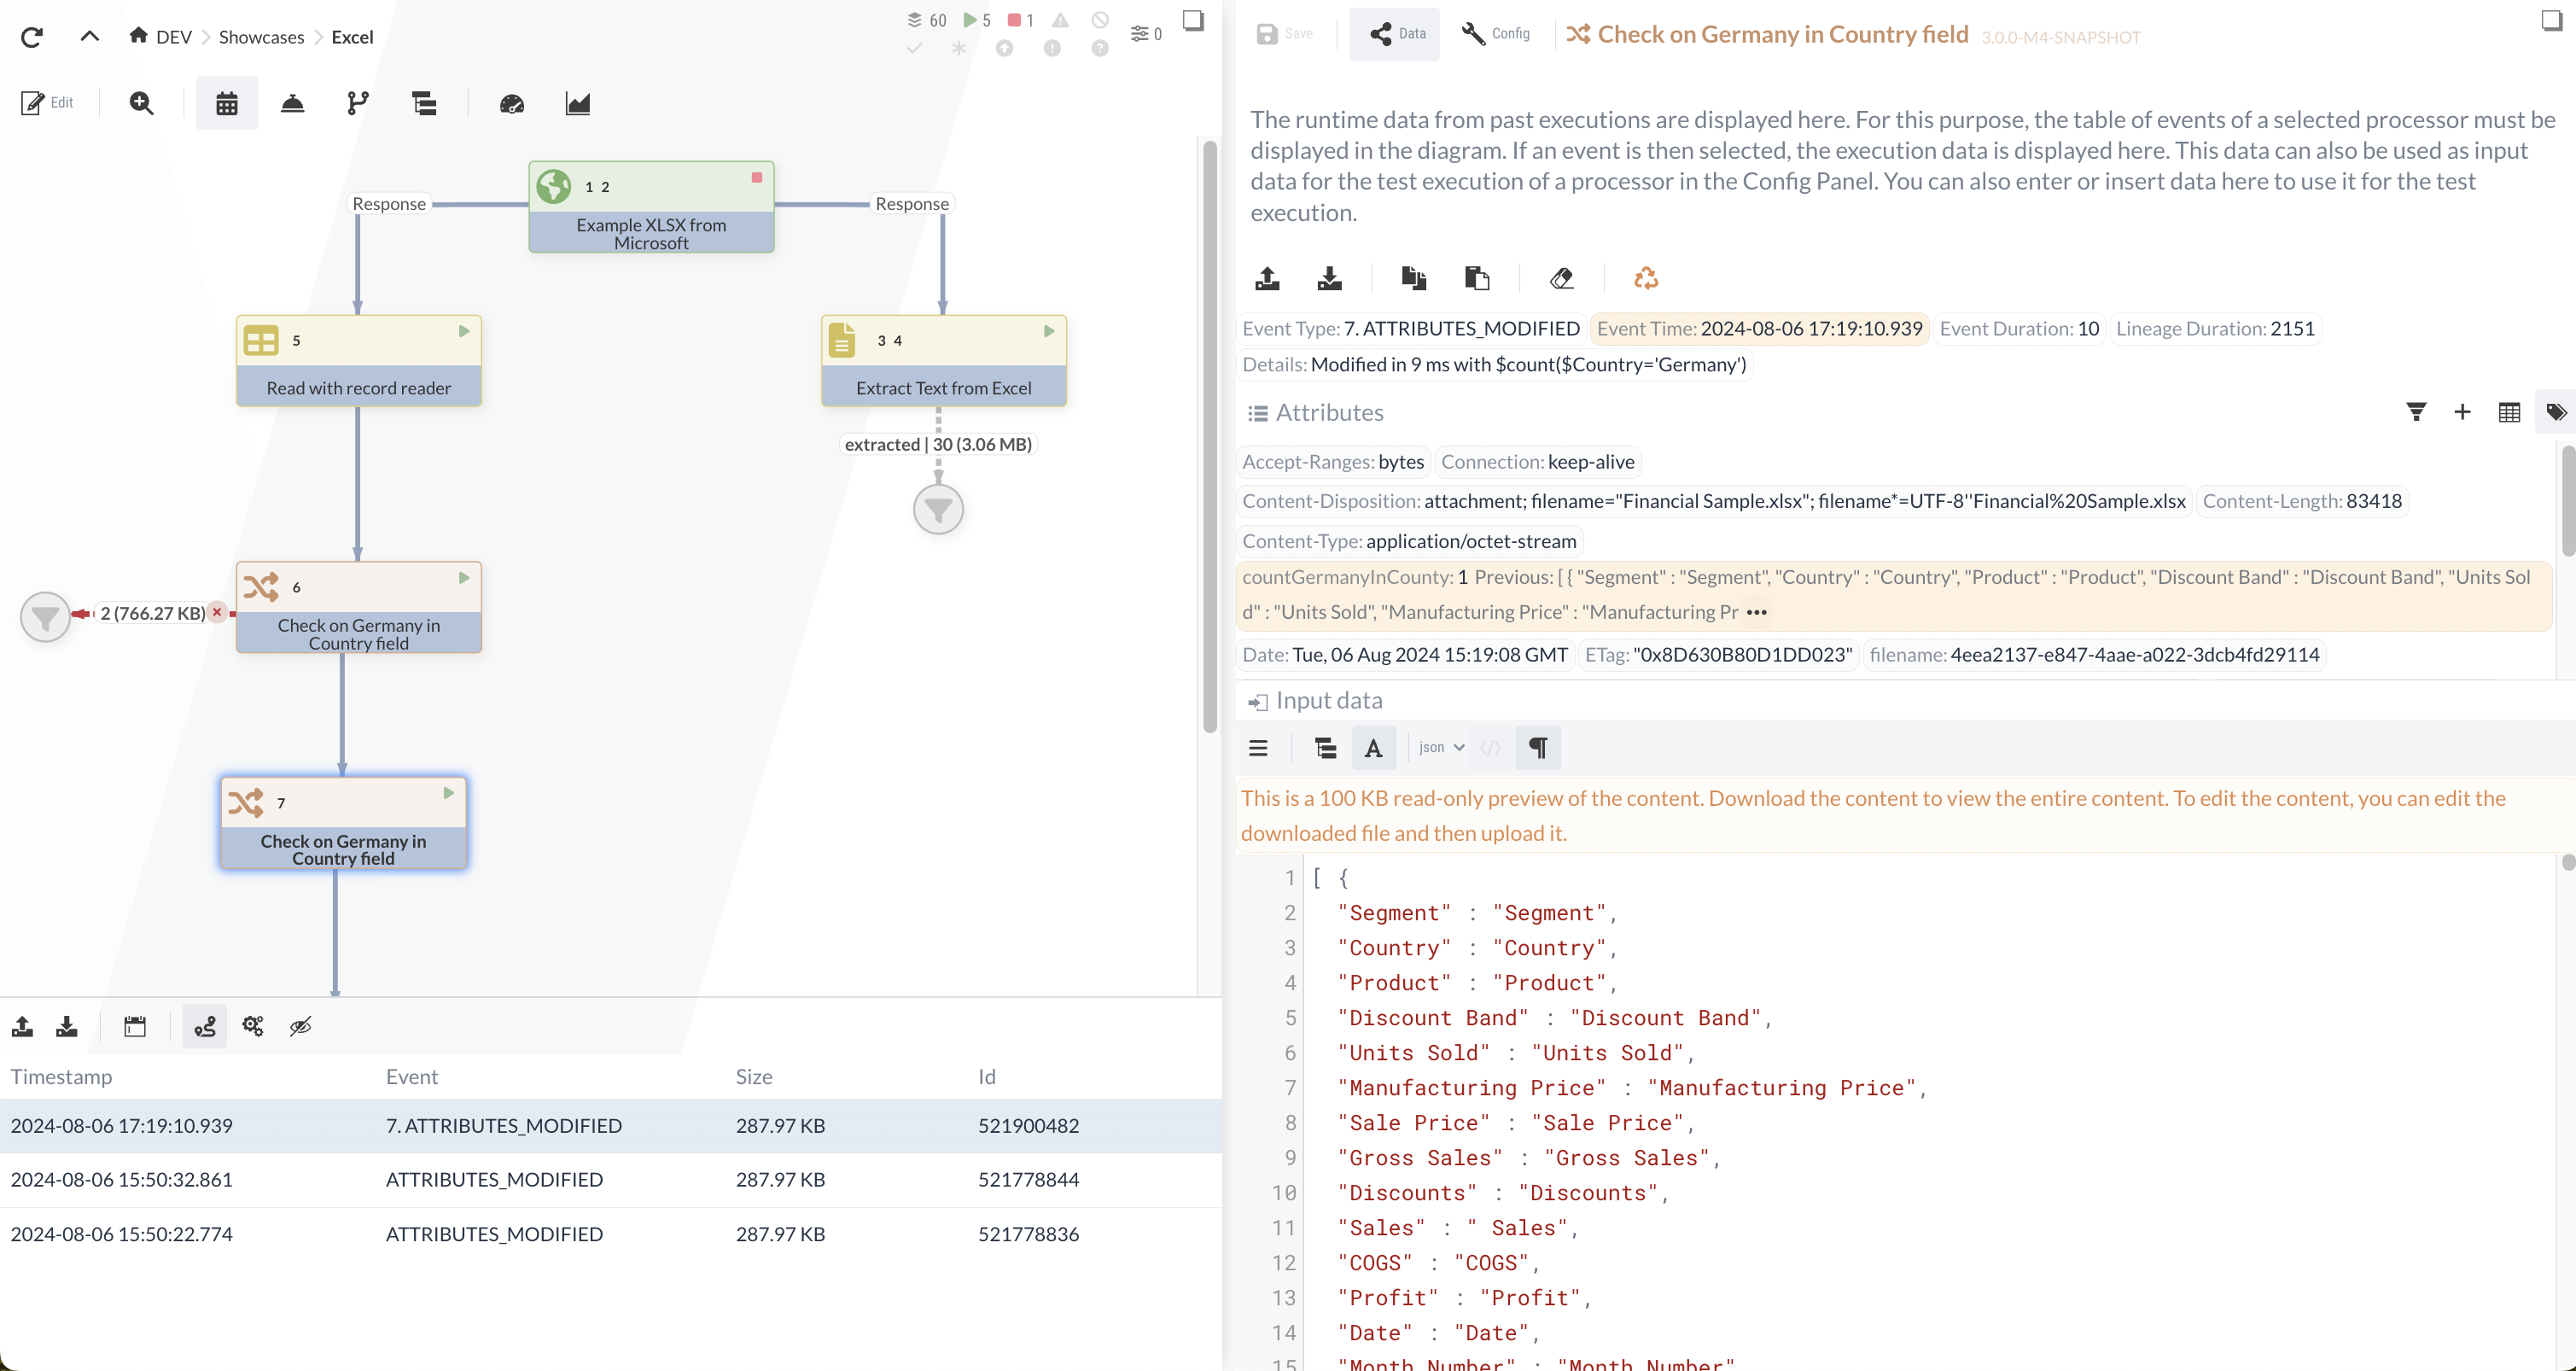
Within the Diagram, numbers are assigned according to the order of execution for better traceability. The respective event number can also be seen in the table below the Diagram.
The data that is displayed when an event is selected in the Data Panel of the configuration area consist of the attributes, the input data and the output data, although not all of them always have to be present.
There may be situations with a large number of events in which it is not possible to determine the complete route directly. This may be the case, for example, if a loop with a large number of runs exists. In this case, you can concentrate on partial routes before or after the loop or only display the data of this one Processor in the Data Panel.
Services
The Services button on the Toolbar opens the area for configuring Services.
Services are hierarchical and can therefore be used within the Process Group in which they were created and in all Process Groups below it.
The window will group the Services by Process Group accordingly.
The current Process Group is displayed first, followed by the Parent Process Group.
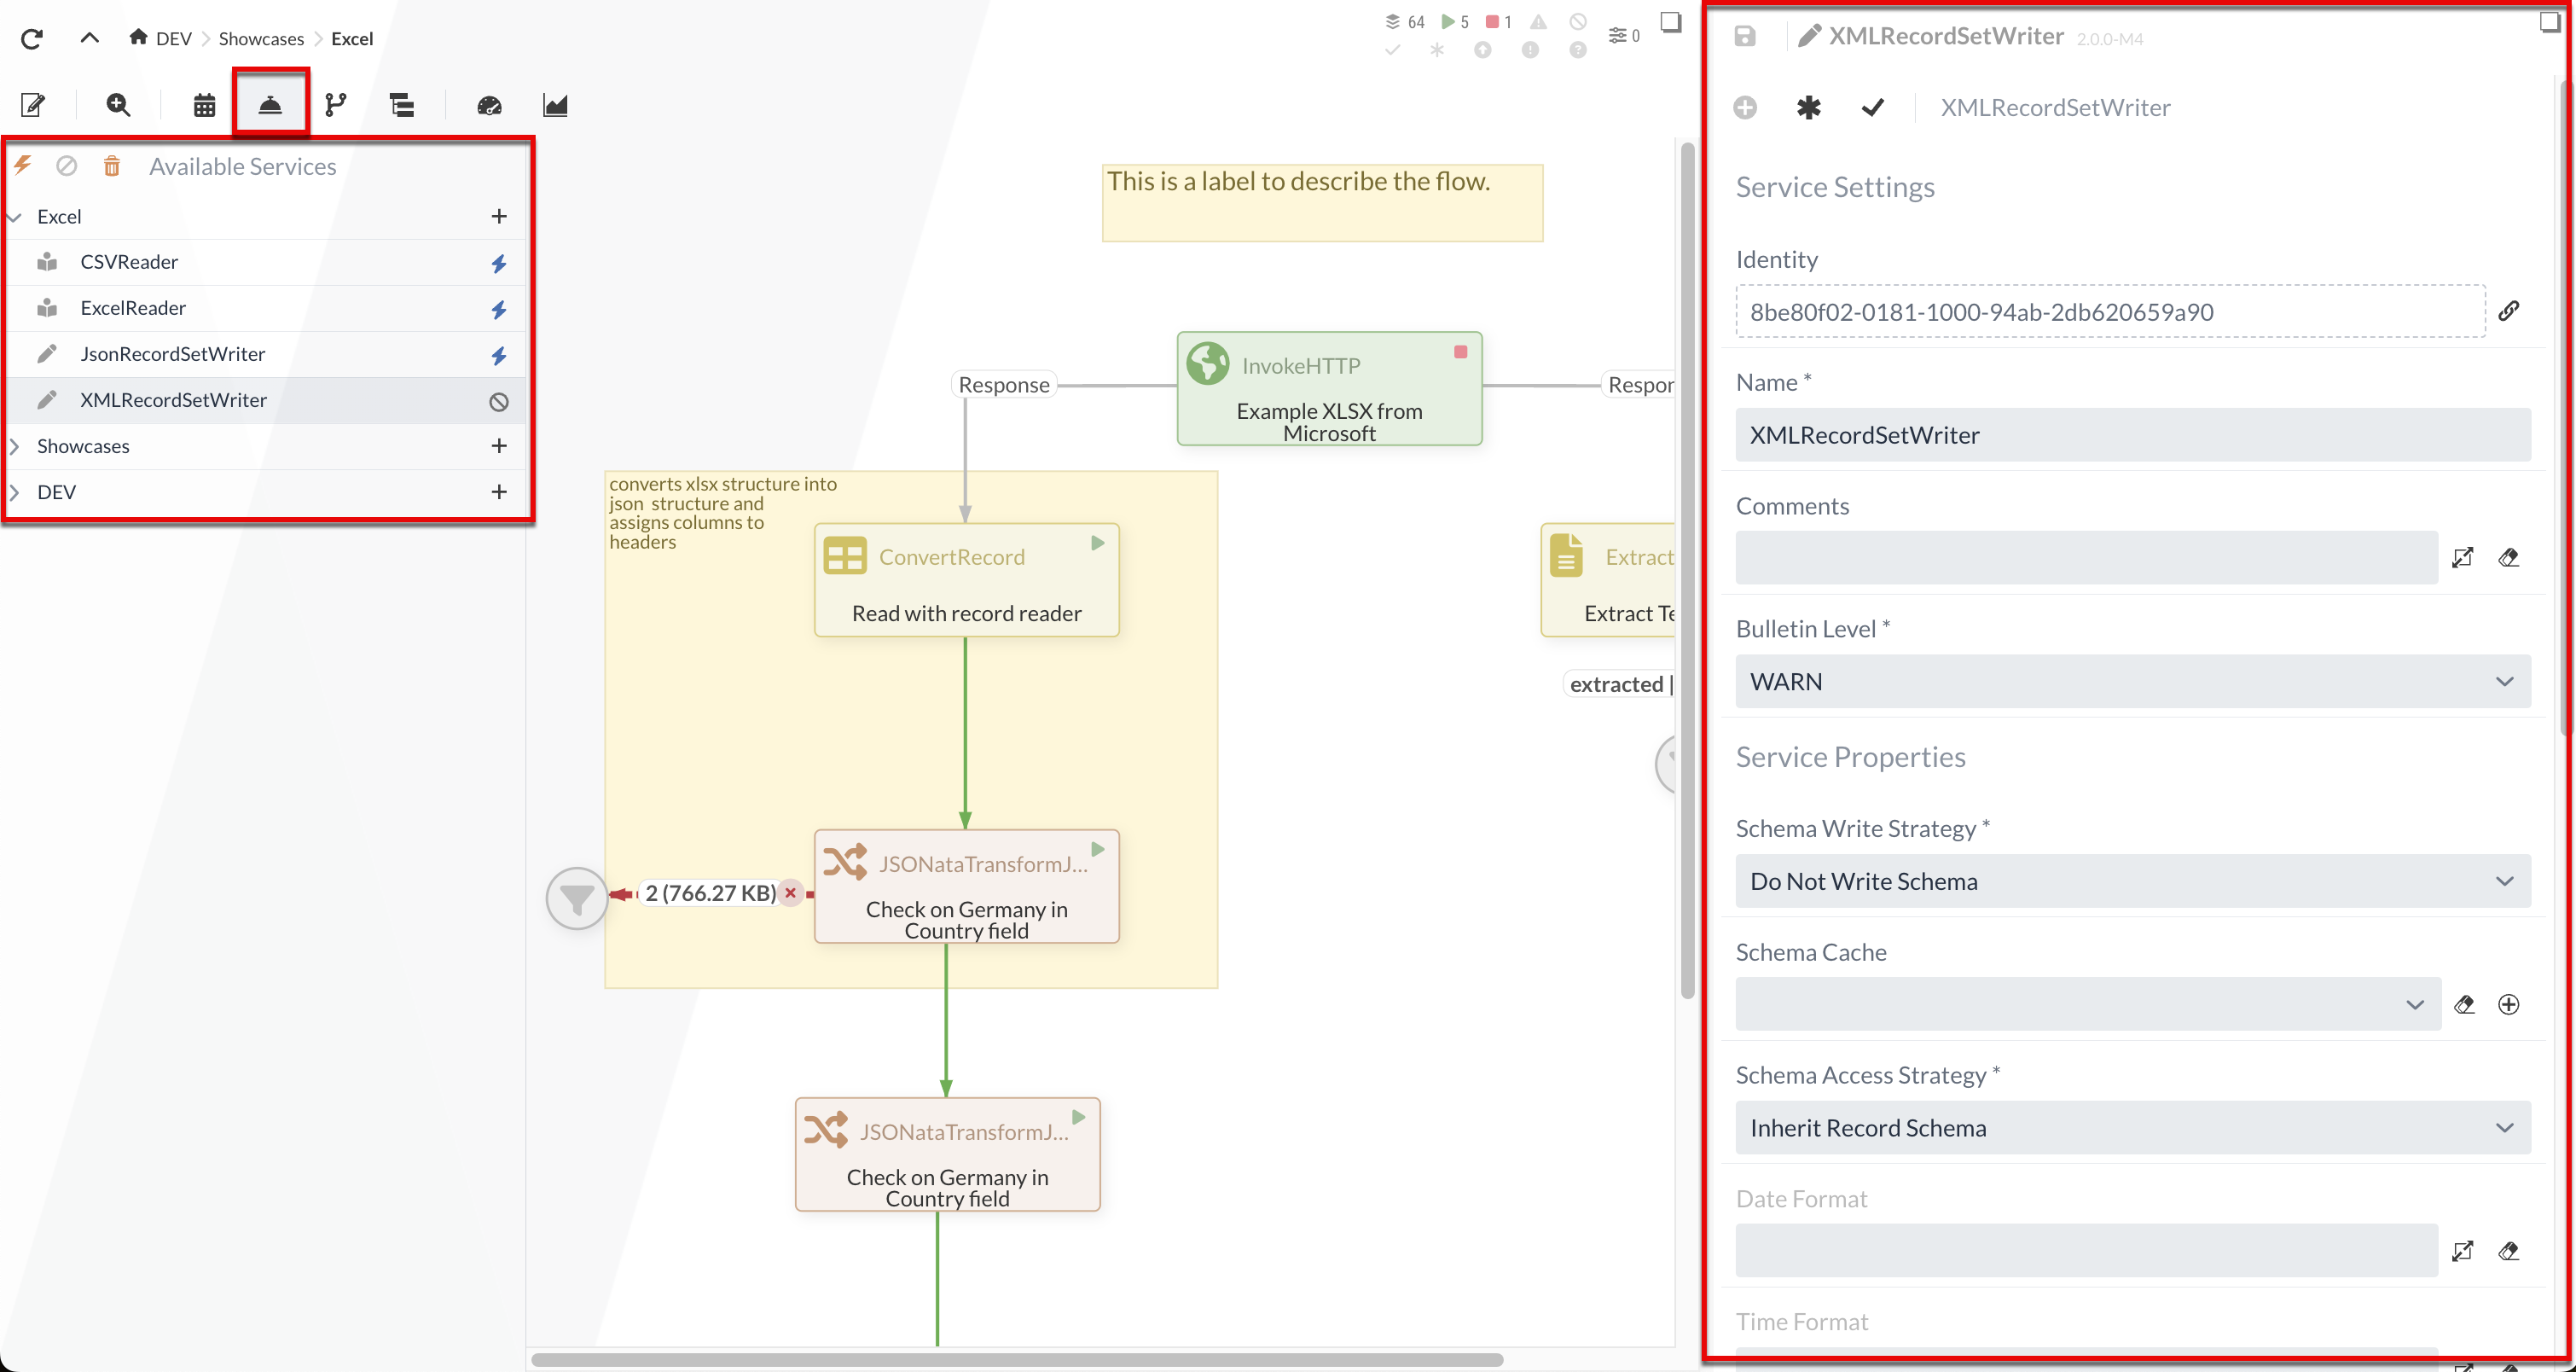
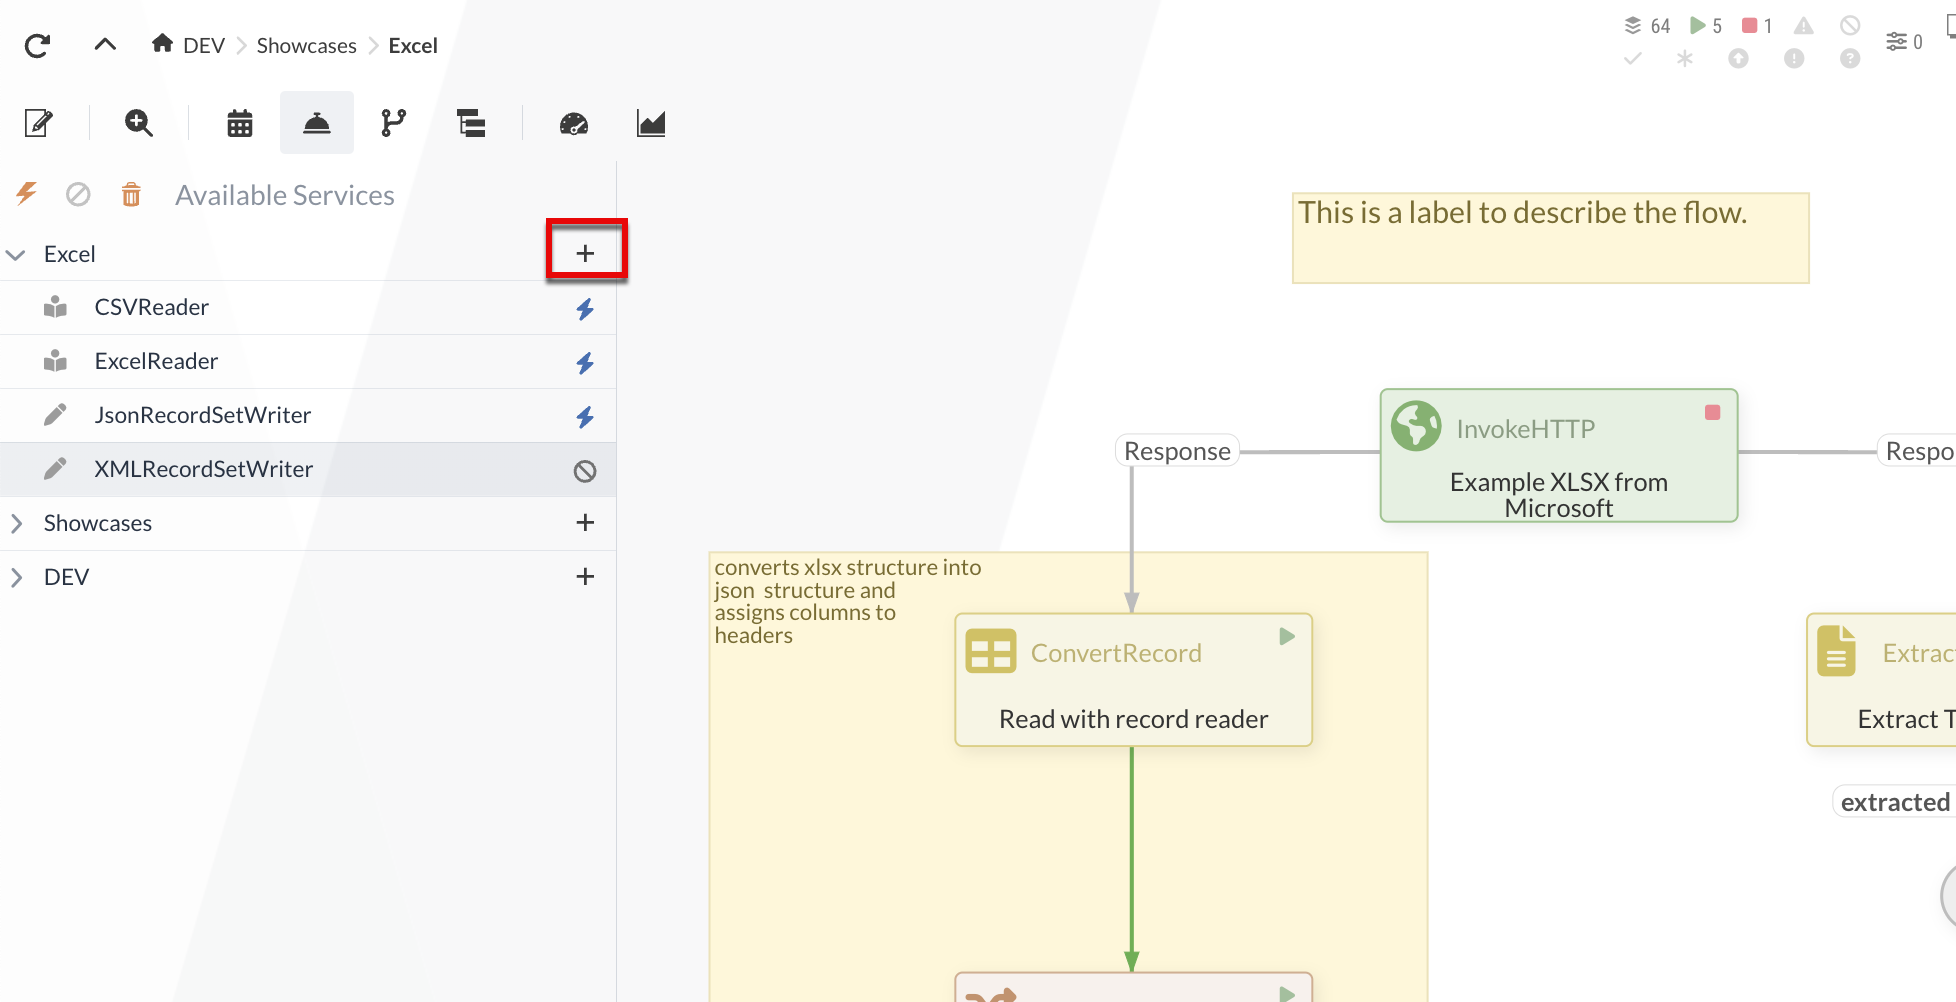
The button in the Services overview can be used to create a new Service.
Similar to Processor, the interaction opens an additional window for selection.
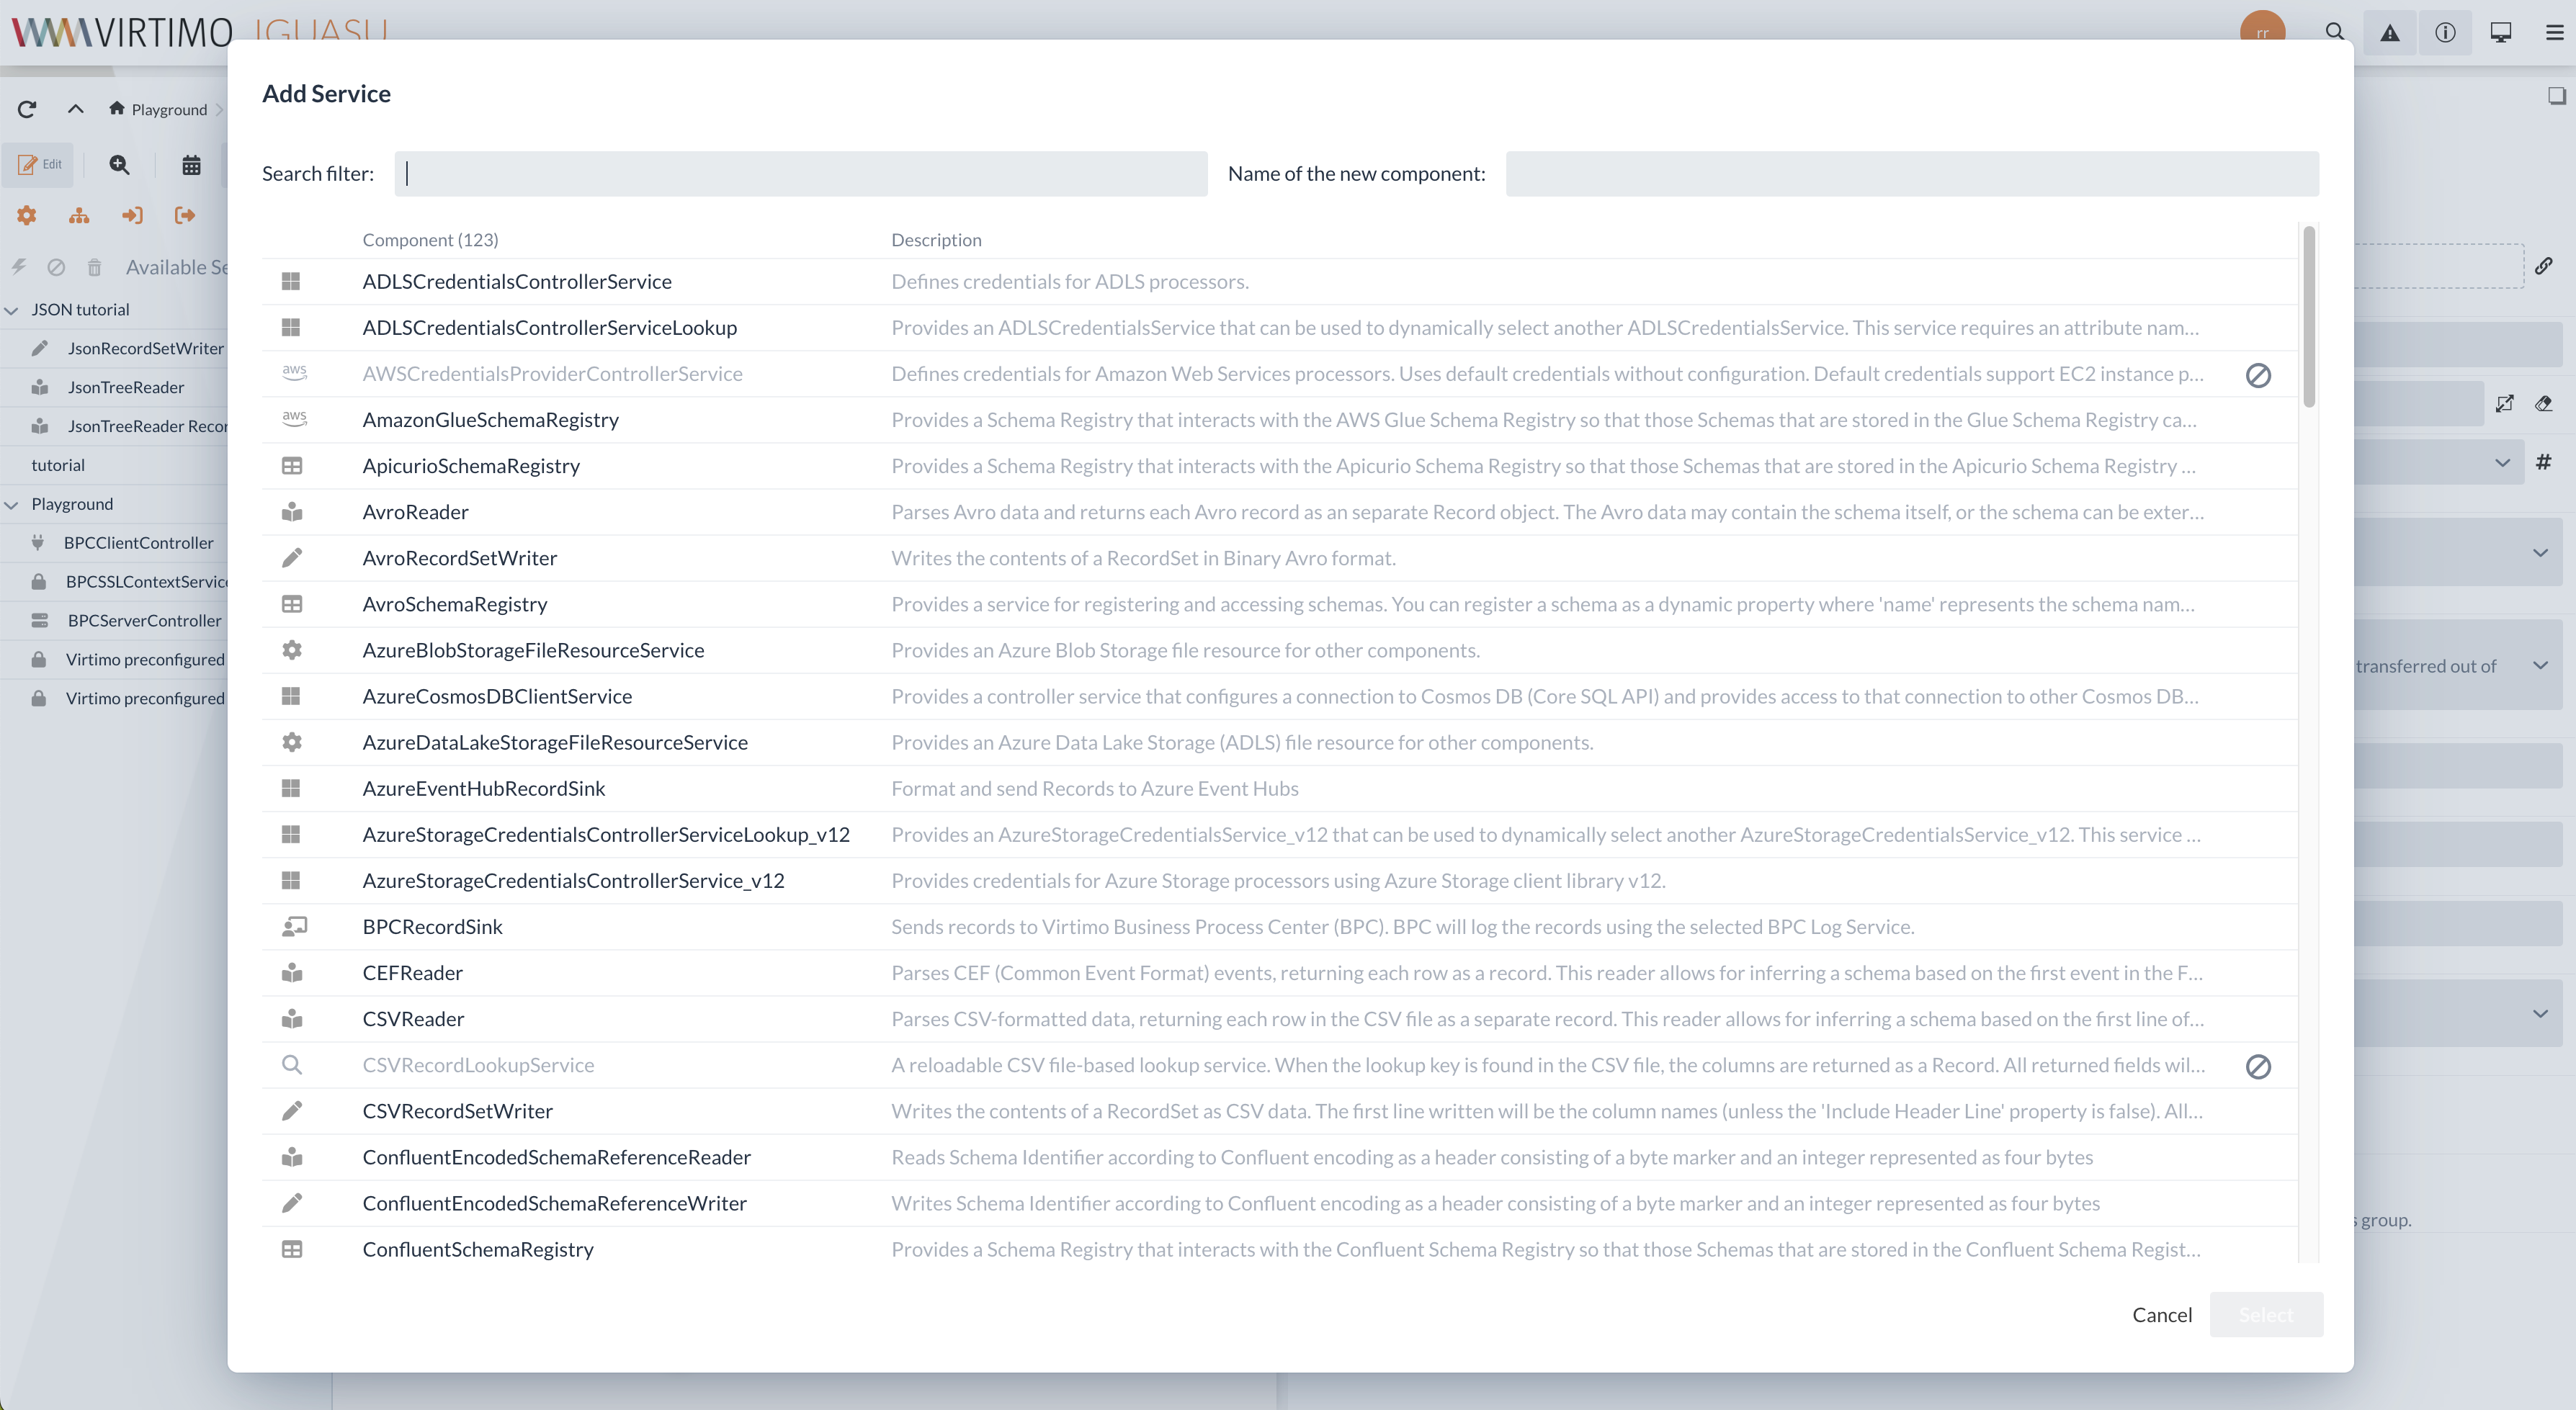
An example of a Service that makes its functionality available to several Processor instances would be a database pool.
A detailed description of some special Services can be found at Selected Services.
Flow Trees
The toolbar can be used to display additional windows in the Diagram for the Process Groups displayed. The Hierarchy button can be used, for example, to open the window for the existing Flow Trees, which displays a hierarchical representation of the existing Process Groups.
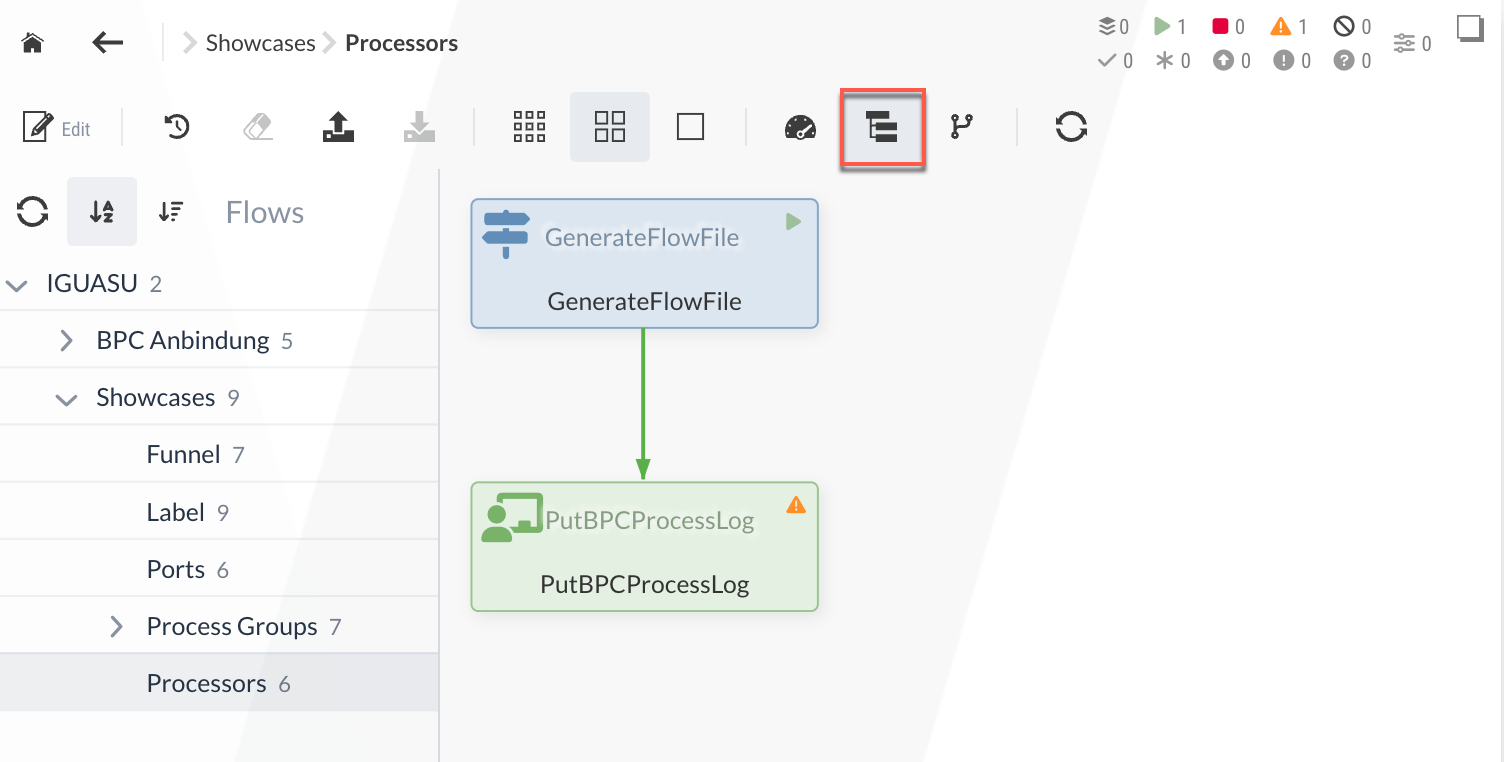
This displays the structure of the Process Group on the left-hand side of the Diagram and can be used to switch between existing Process Groups.
Processing statistics
You have the option of displaying additional information about the Processors and Process Groups.
This view can be switched on and off by interacting with the icon. The statistics displayed always refer to the last 5 minutes.
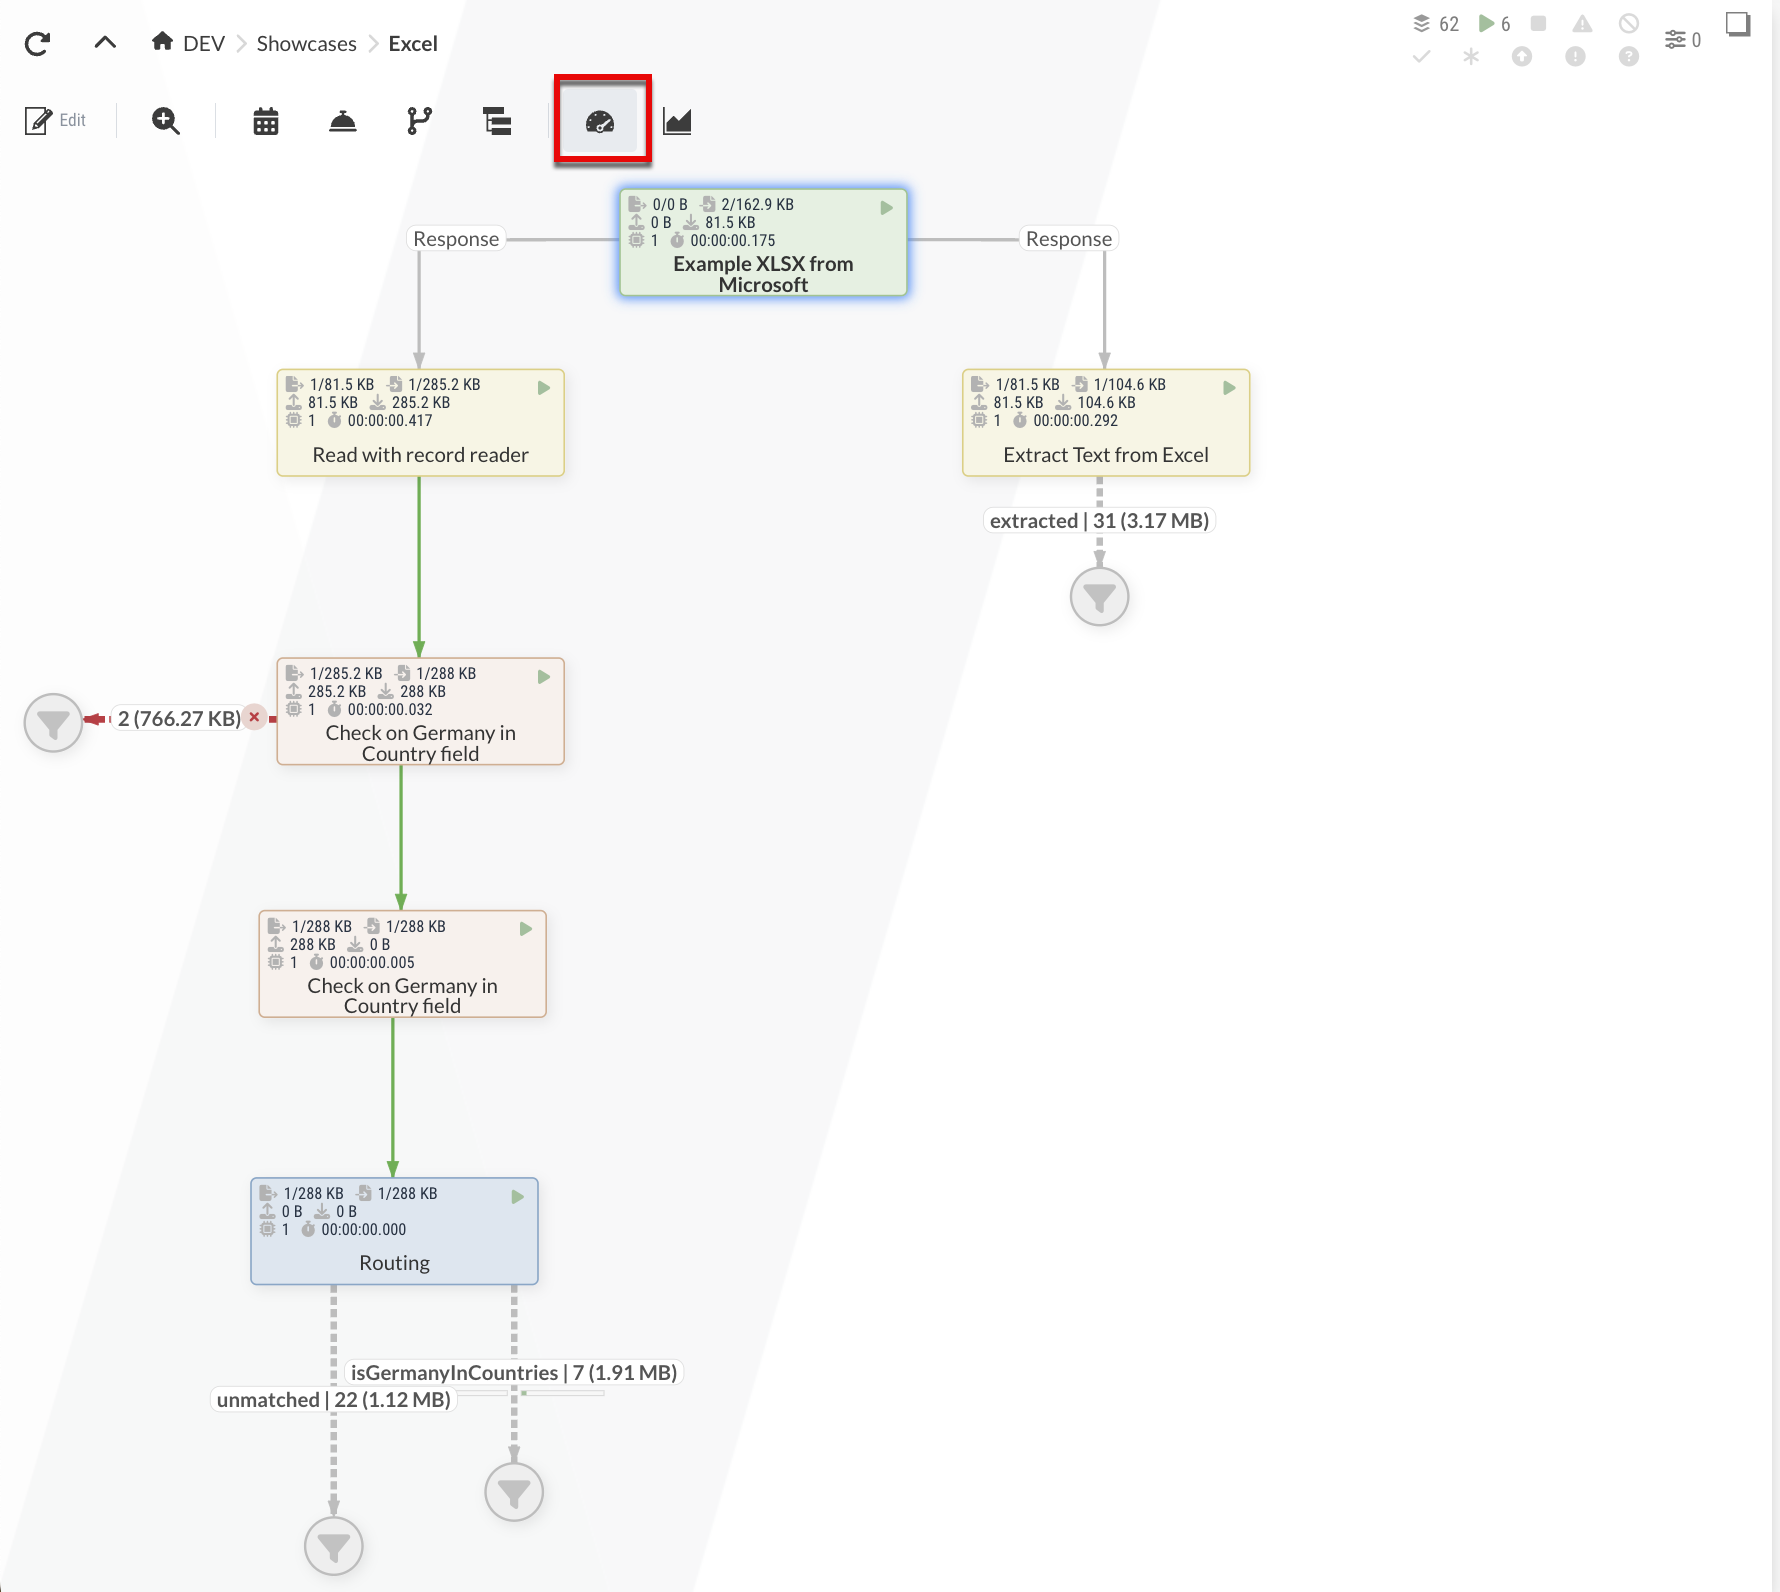
The first line shows how many FlowFiles have been received and forwarded and how large they were.
The second line shows which data volumes were sent to the Processor and which were forwarded (e.g. in the case of an HTTP call from an external system).
The last line shows the number and duration of Processor executions.
Edit mode
The edit button is used to switch to the diagram’s edit mode.
In this mode, the functions and content presented in the view mode can still be called up.
It is also possible to create, delete, move and connect elements.
For this purpose, another toolbar is displayed below the normal toolbar in the diagram, in which the editing actions can be selected.
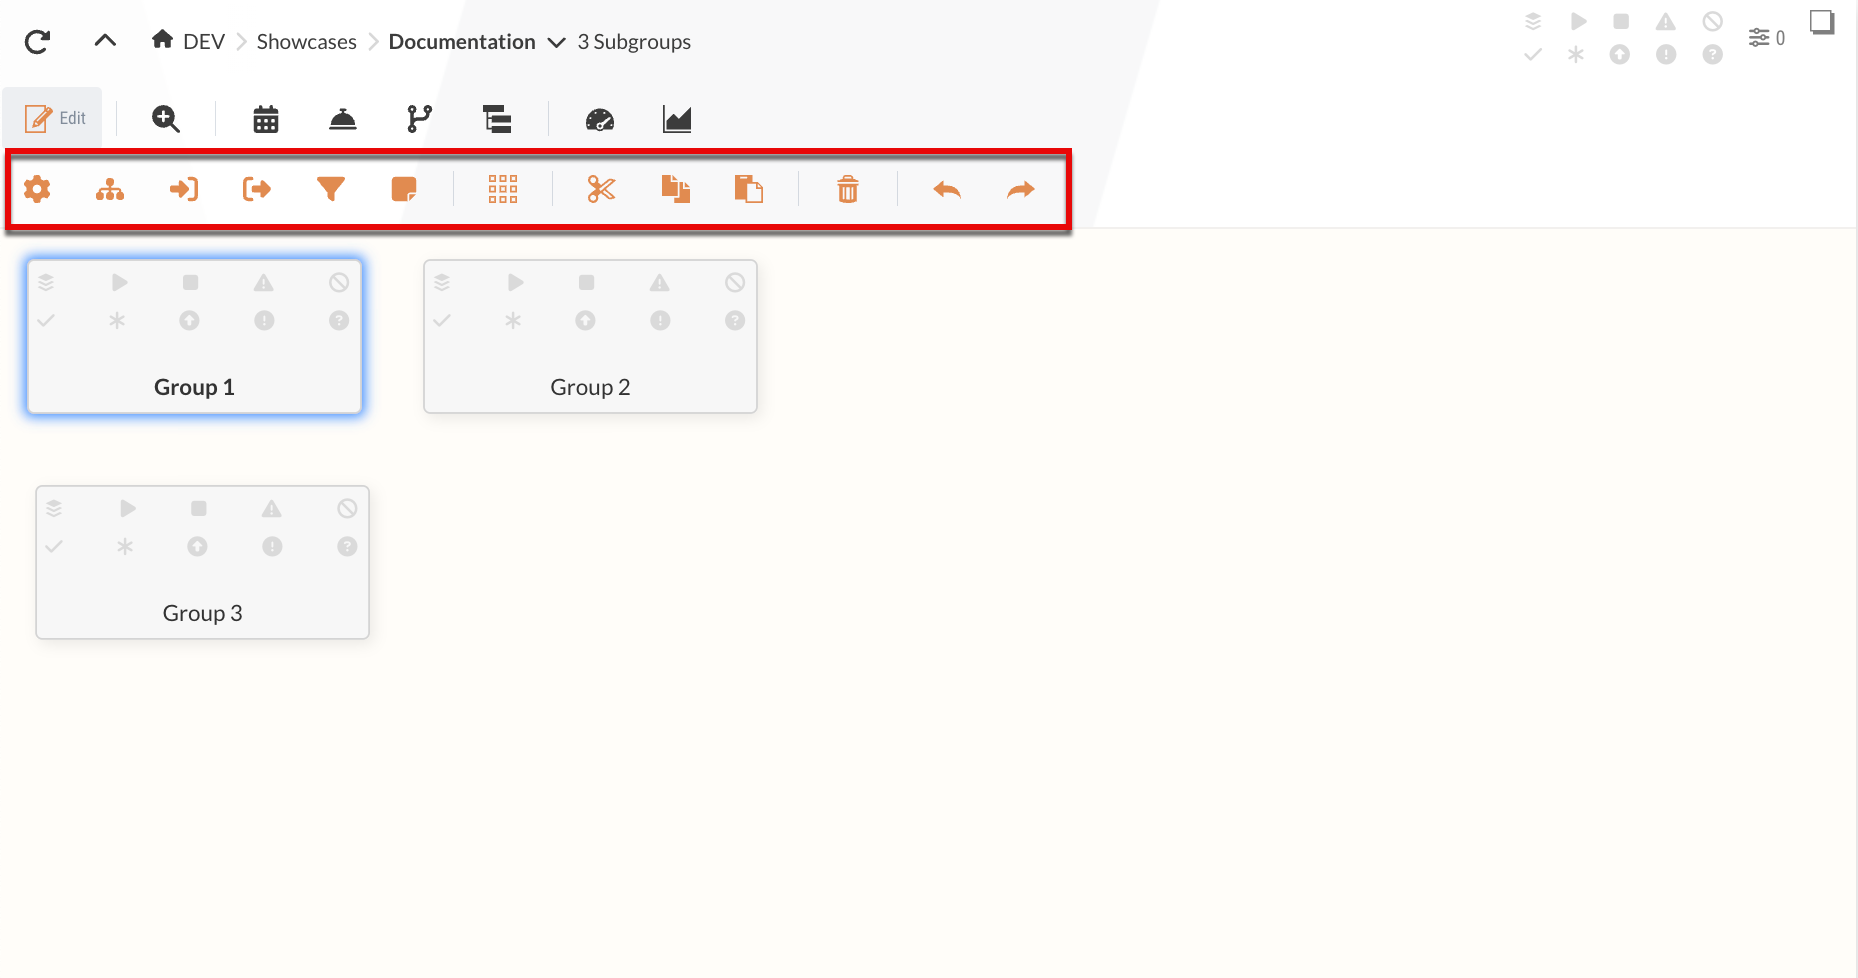
There are different types of modules under the editing actions. These can be dragged and dropped into the diagram to create them.

The following table shows the editing functions of the toolbar (see View mode for an overview of the black function icons):
| Icon | Description |
|---|---|
|
Creates a Processor |
Creates a Process Group |
|
|
Creates an Input Port |
|
Creates an Output Port |
|
Creates an output port Funnels |
|
Creates a Labels |
|
Changes the size of the displayed elements in the Diagram |
|
Cuts selected elements in the Diagram |
|
Copies selected elements in the Diagram |
|
Pastes previously copied or cut elements |
|
Deletes the selected element |
|
Undoes the last step |
|
Restores the undone actions |
Diagram-Elements/Modules
Process Group
For structuring Processors process Groups can be used to structure Processors.
These groups enable the creation of hierarchies or the grouping of functions within the Diagram.
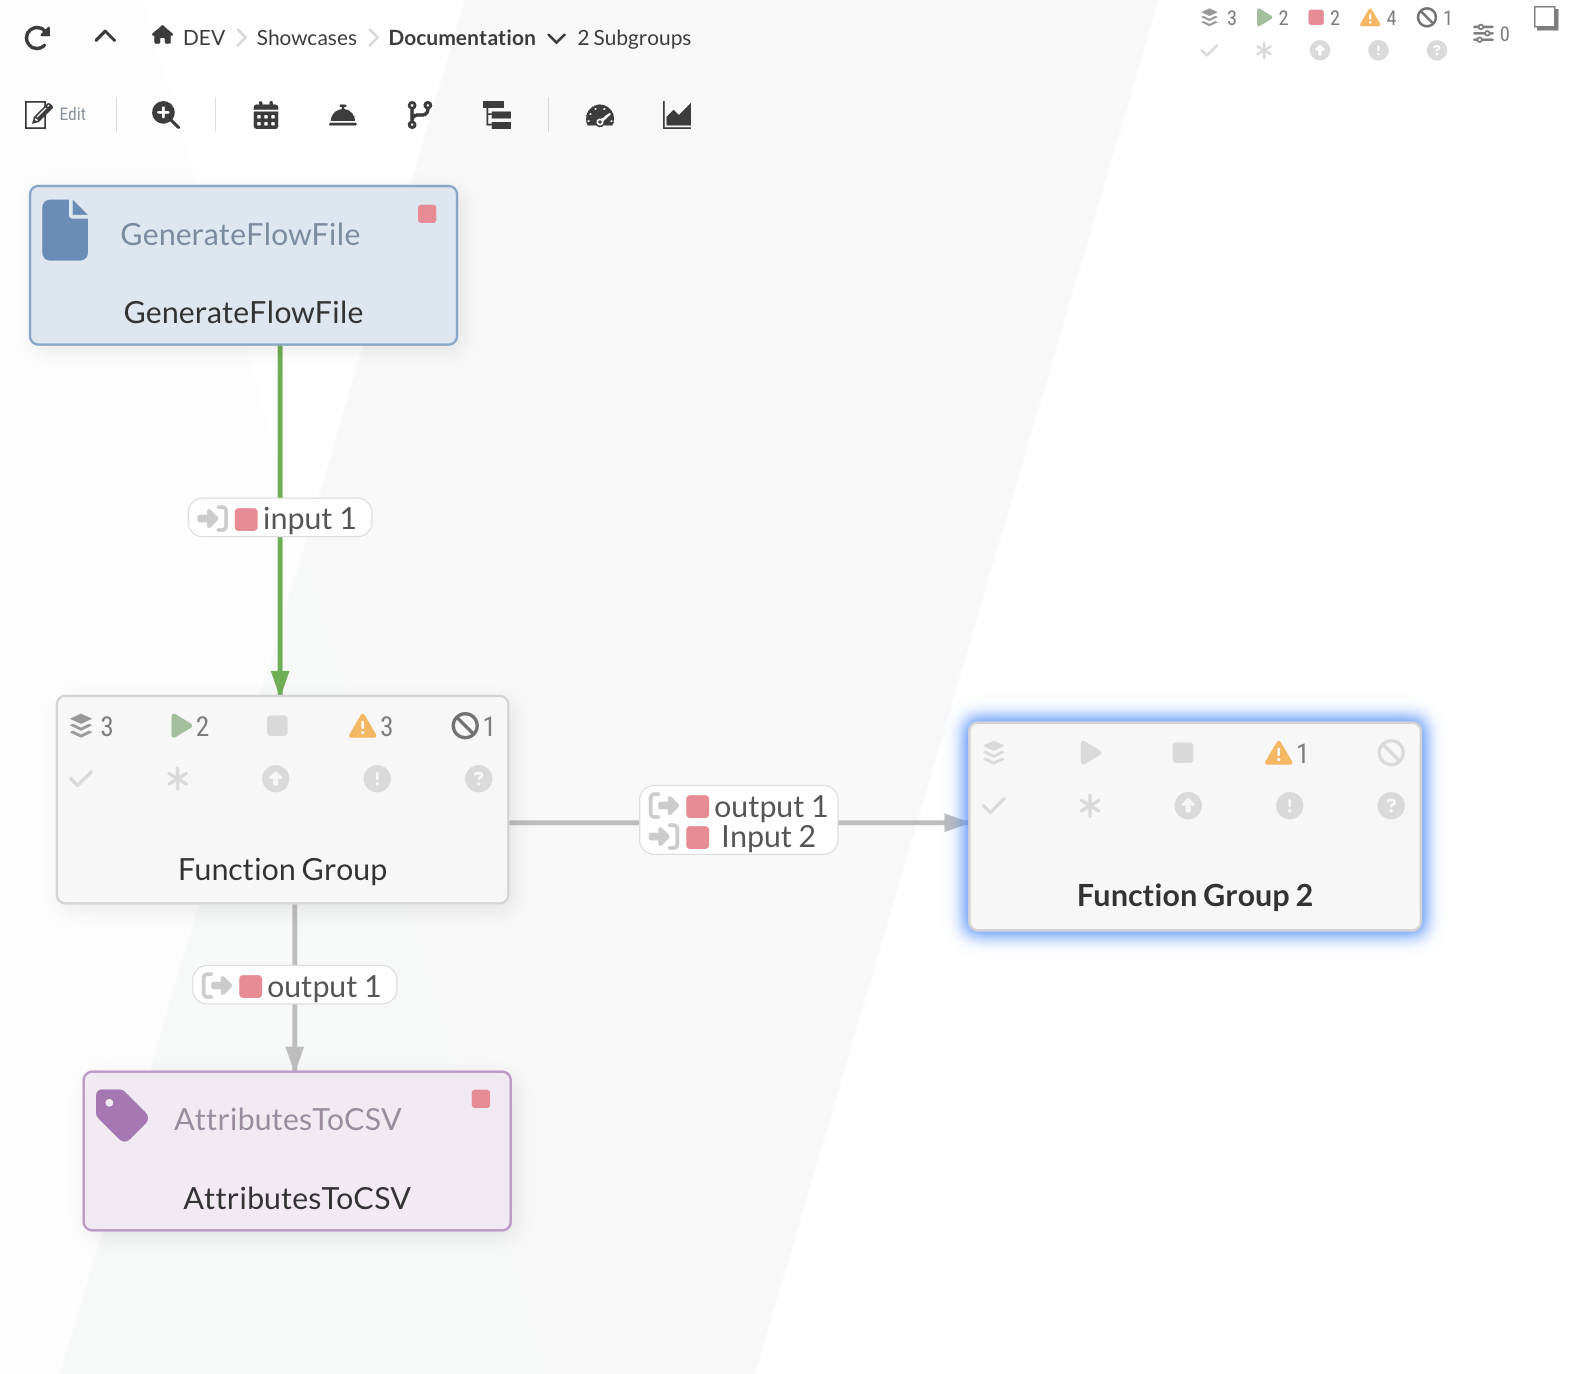
Hierarchies can be constructed without further customization by creating Process Groups. Previously created groups can be used as a template for creation, which are available either through the registry or by uploading the previously downloaded JSON file. New Process Groups can be created by defining a name. Process Groups or elements that have already been created can also be added to an existing Process Group using drag-and-drop. Navigation between the groups takes place via the Navigation bar in the Diagram.
Functions for processing FlowFiles can be combined in Process Groups. In order to enable the input and output of FlowFiles in subordinate Process Groups, you can define Ports can be used.
To improve the overview, the states and information on Versioning the contained Processors are also illustrated with small icons. This information is also displayed at the top of the Diagram for the current Process Group, see Diagram toolbar.
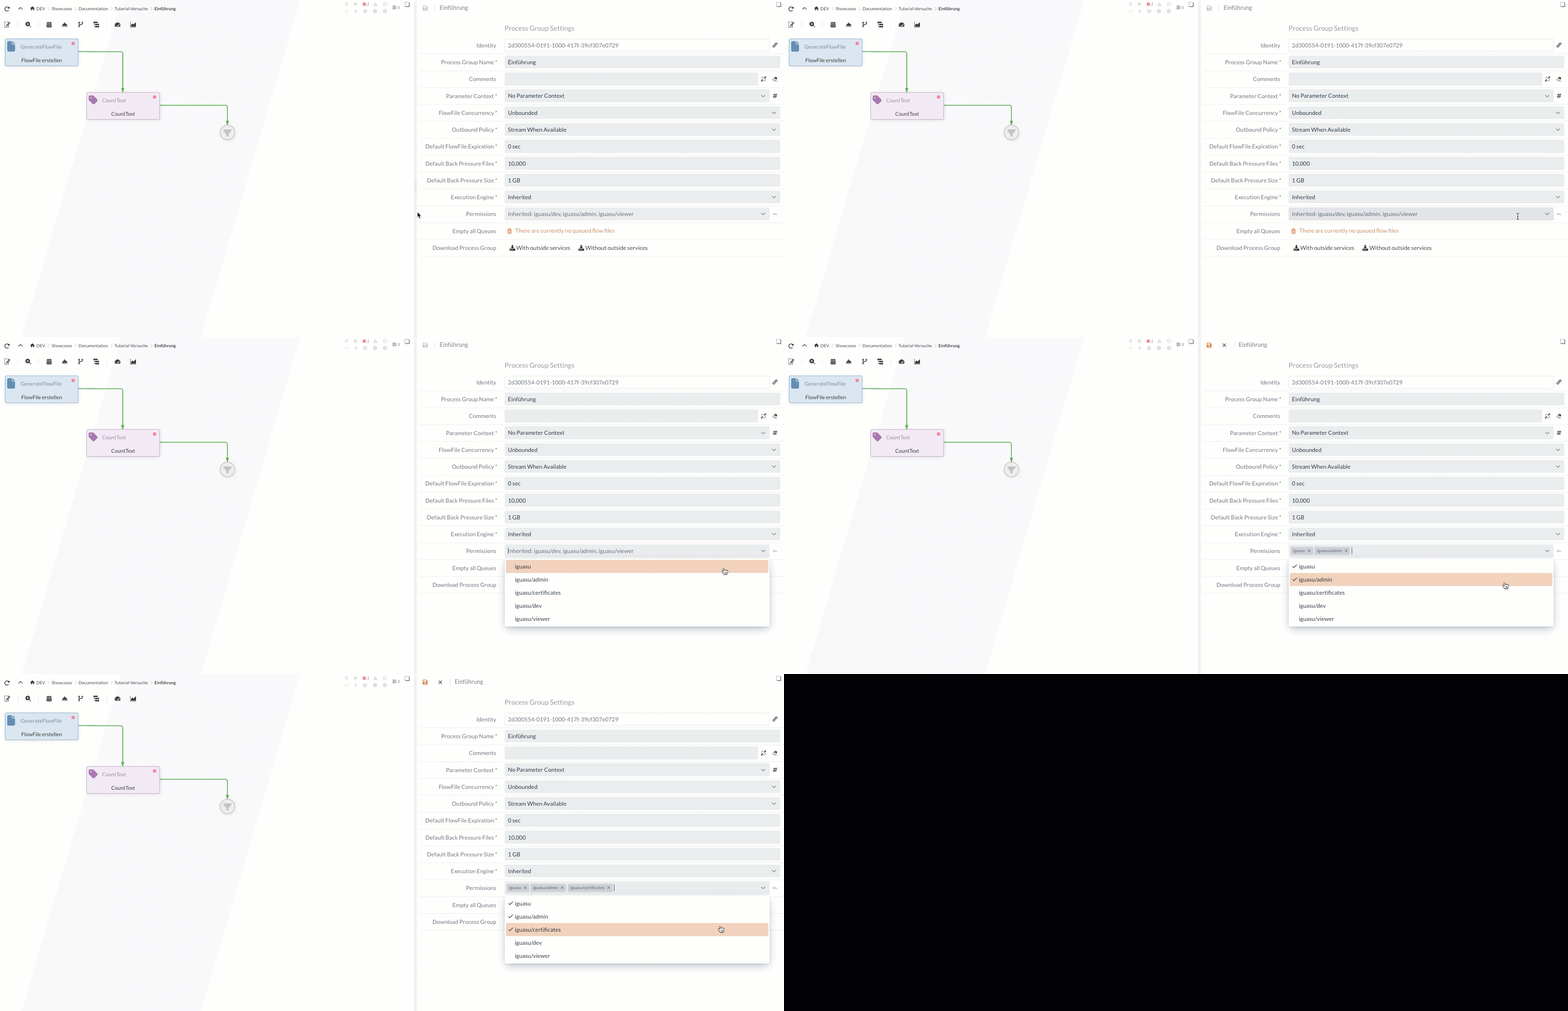
In addition, "Permissions" can be selected as admin user in the Process Group. A number of user groups can be selected by multiple selection. If no groups have been clicked, the Process Group can be used and read individually.
Execution Engines and Stateless Process Groups
|
Stateless Execution Engine is a new beta feature. Some Processors and Services can still act incorrectly. |
Stateless Execution Engines can be used for Process Groups in addition to the standard Execution Engine. The entire process within the Process Group is scheduled and executed in isolated processes.
All Processor within the group complete the processing of an incoming FlowFile before new FlowFiles are processed.
FlowFiles within the Process Group are not persisted.
The entire Process Group therefore behaves like a single Processor.
|
If a Process Group is "stateless", then all the elements it contains are "stateless". Only include the flows in these Process Groups that should also be "stateless". |
As a rule, the Stateless Execution Engine is used if the processed data:
-
originates from a single transaction source,
-
has a single destination,
-
and should behave like a single process that can only either be successful or fail in its entirety when viewed from the outside.
Example:
The data source is a message broker.
You want a received message to be acknowledged only after successful processing or, in the event of an error, for the message to be acknowledged negatively (answered with a "NAK") and thus resent by the message broker.
|
The Stateless Execution Engine has potential disadvantages:
|
Processor
One of the core elements of IGUASU are the Processors, which provide various functions. The Processors are configured via Configuration area in order to adjust individual or general settings.
Processor classes
The Processors are divided into five classes, which are shown in the Diagram with a specific color:
System |
Access to external systems (from the perspective of IGUASU). Examples: Databases, file system, a web service, AWS-S3, etc. |
Transformation |
The content/data is changed. Examples: Execution of XSLT, text replacement or general scripting such as in Groovy |
Routing |
Processors that primarily refer to the logic of the processes. For example, which output should be routed to based on an attribute or the splitting of an XML document into many smaller ones. Overall, this is therefore about routing, splitting, merging, jumps, etc. |
Metadata |
Processors that primarily relate to metadata (attributes) of the FlowFiles and typically leave the content untouched. For example, the creation of an attribute from parts of the content. |
Conversion |
Conversion directly from one format to another. For example, from Avro to JSON or from any content to a zipped format. |
To provide an improved overview and make it easier to understand the task of a Processor, an icon is displayed in the Processor in addition to the color differences.
This enables additional differentiation between Processors of the same class.
Selection of Processors
Processors can be created by dragging and dropping them into Diagram. This opens a window in which all Processors available in the system are listed.
To extend the search for the appropriate option, the name can also be searched or the selection can be filtered with regard to the above-mentioned classes.
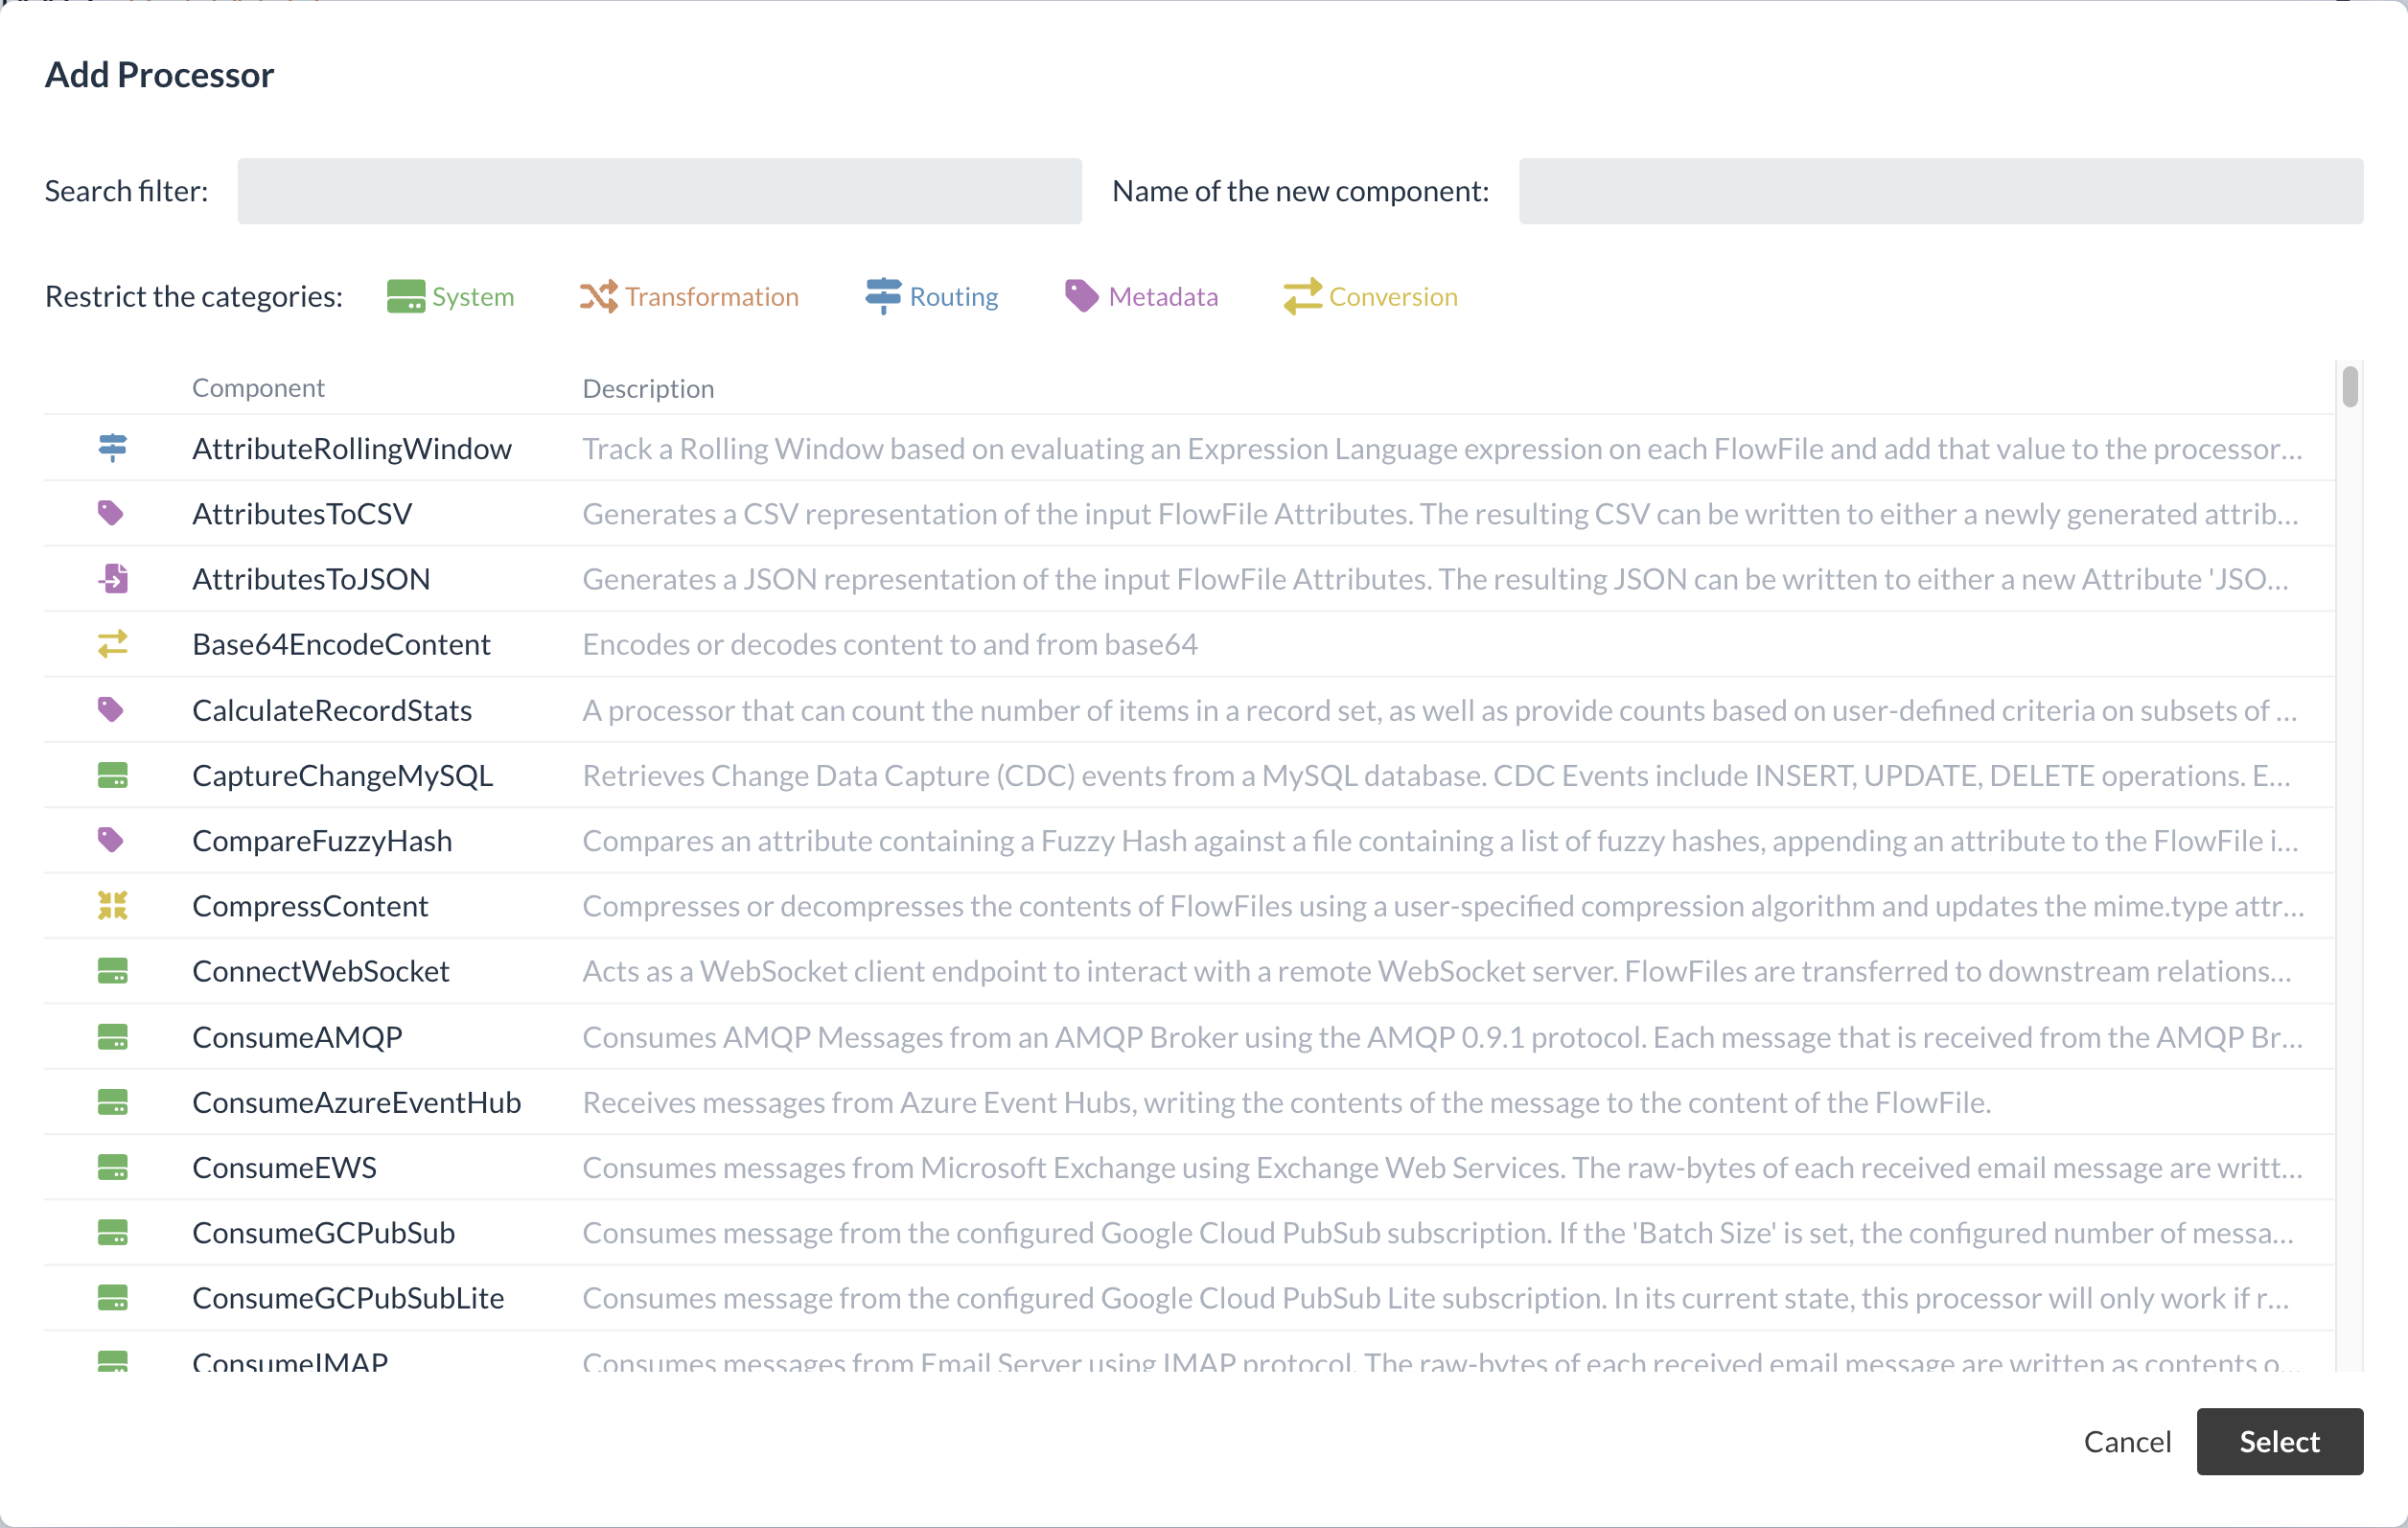
A suitable display name can be specified in the selection window during creation.
Some Processors also use Services to perform the tasks. Further information on this can be found in the section Selected Services.
Processor states
Processors can be in different states. The status of a Processor can be seen at the top right of the small icon.

If a new Processor is created, a warning message is displayed first by default, as the required information often has to be entered in Configuration area first.
Once all the necessary configurations have been completed, the Processors are initially in a stopped state.
By right-clicking on a Processor, it can then be set to "running" or executed once.
They can also be deactivated or reactivated via the context menu.
Labels
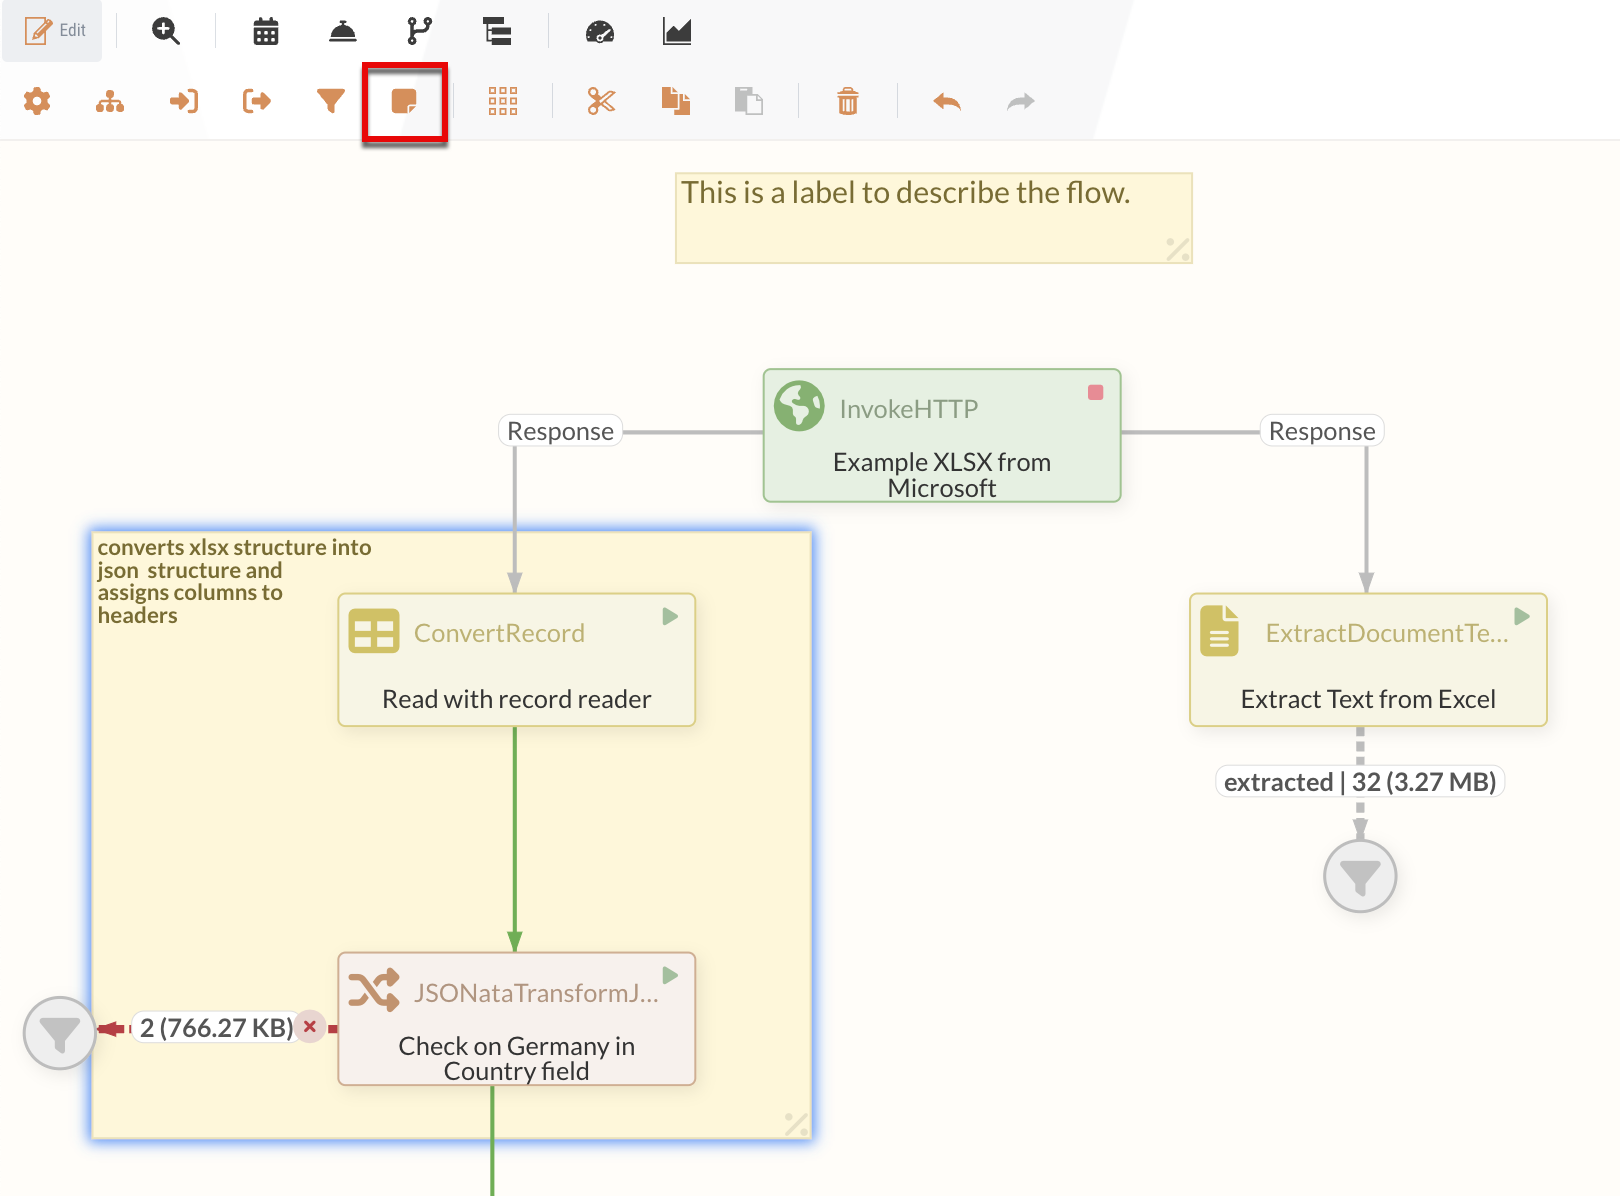
Labels can be used like post-its to describe elements or flows in the Diagram.
To create a Label, drag and drop it from the toolbar into Diagram.
The font size and background color of created Labels can be adjusted in Configuration area.
If the eraser button is used for the background color, the default color (#fff7d7) is restored.
Labels are the only elements in the Diagram where the size can be adjusted when editing mode is activated. In addition, Labels are always in the background of the other elements, which means they can also be used to highlight and describe sections in the flow. An example of both use cases for Labels can be seen in the following figure.
Funnels
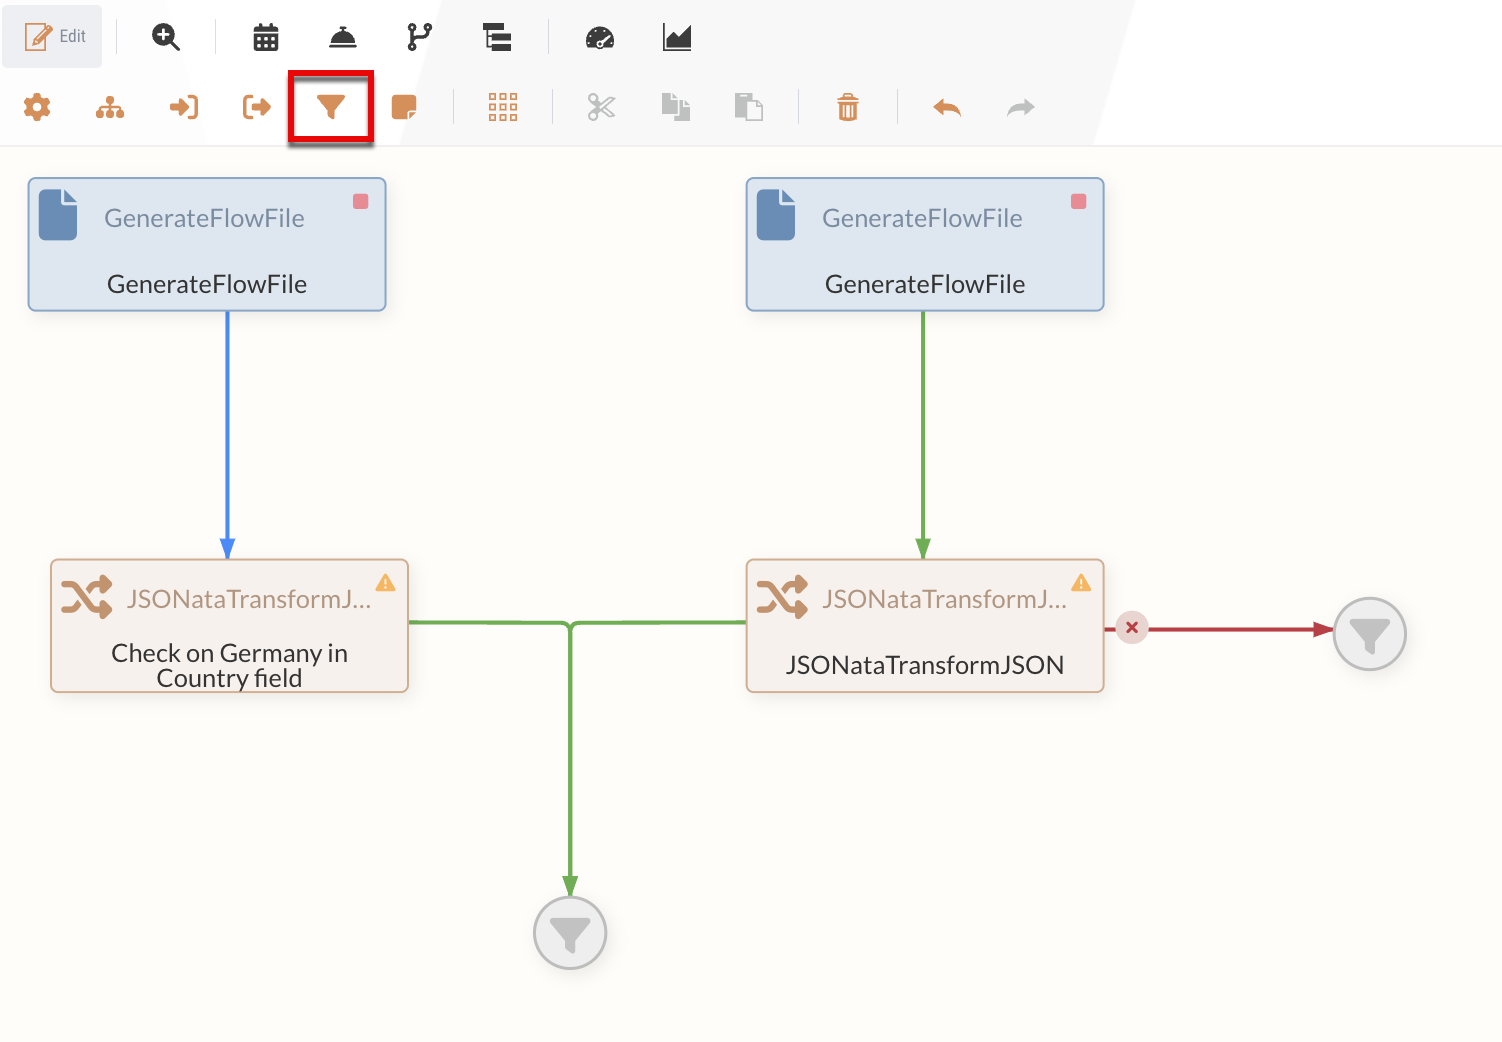
Funnels can be used to receive outgoing connections.
In contrast to other elements in the Diagram, e.g. Processor, Funnels cannot be configured and also do not make any changes to received FlowFiles.
This makes them very suitable for merging multiple connections, for example, i.e. turning several edges into a single one, or intercepting errors that have occurred.
FlowFiles that have been routed to a Funnel are visible on the edge in front of the Funnel.
Example of merging and use in the event of errors:
Port
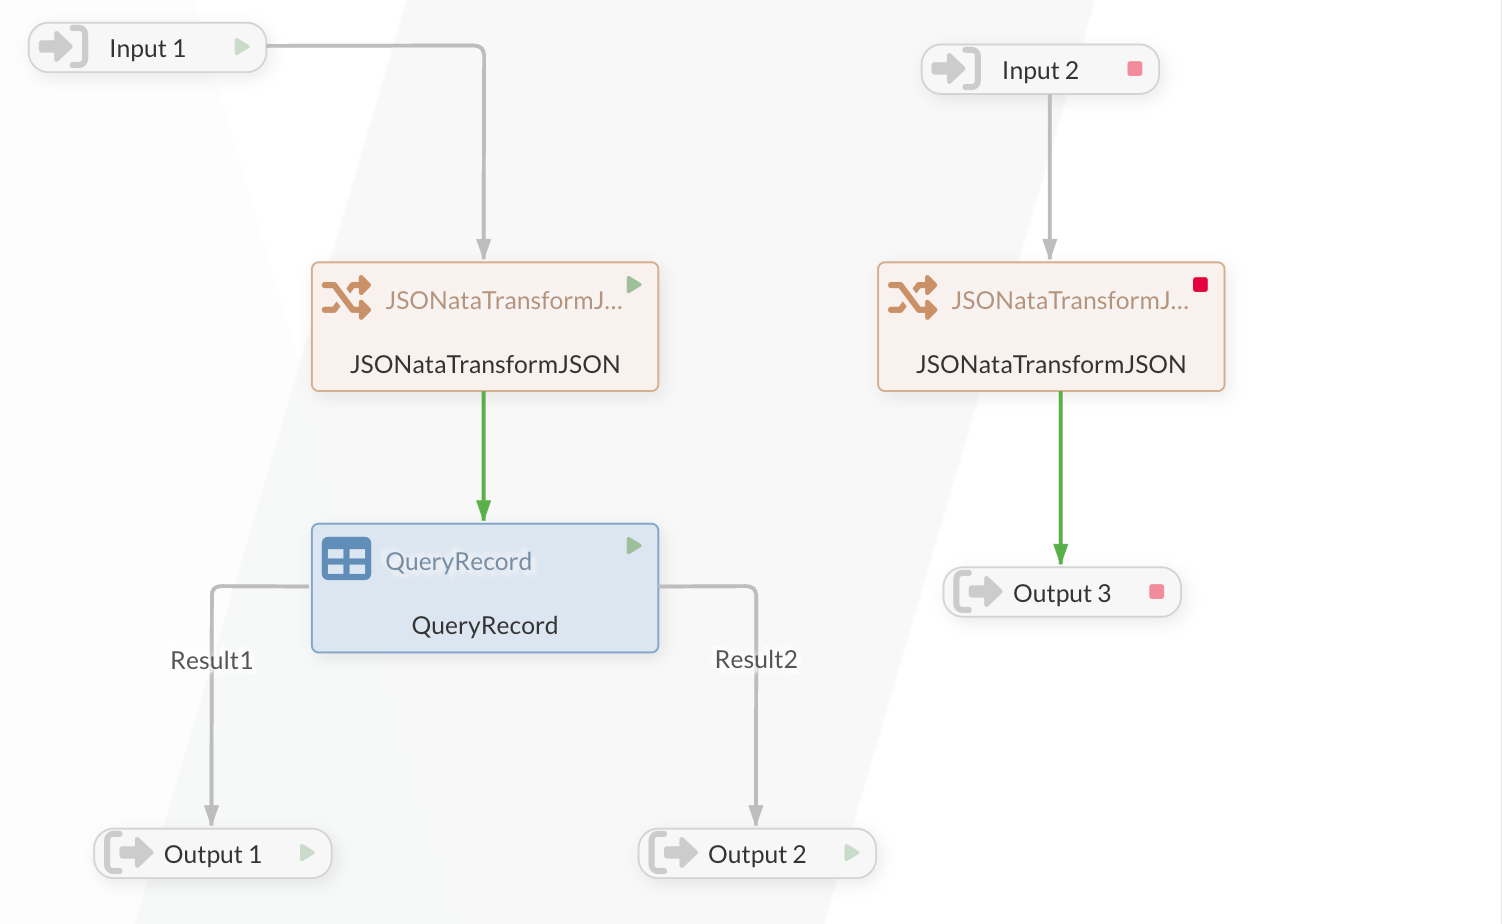
Ports are used as an interface to establish connections to Process Group.
If a FlowFile is to be processed within a group and then forwarded to the higher-level group, both an Input Port and an Output Port must be available.
Input Ports declare the starting point of the FlowFiles received within the Process Group.
Output Ports, on the other hand, define the interface via which the data is forwarded to the higher-level group.
When creating the Input and Output Port, a name can be defined that can be customized in Configuration area.
If several ports are available within a Process Group, you can select which port is to be used as the interface for the flow when creating the link.
Similar to Processor, ports can also be in different states, e.g. "running", "stopped" or "deactivated".
Example of the use of multiple ports within a Process Group:
Connection
Connections are the links between elements. These are drawn in particular between Processors and form the inputs from the perspective of a Processor and the relations as outputs. In addition to Processors, connections are also drawn to Ports (and thus also to Process Groups). Funnels can be used to assign several inputs to one.
The first 100 entries in the queue can be viewed on the Queue Panel. It should be noted that this can be difficult when the Processors are running, as the entries entering and leaving the queue change very quickly.
The queue can also be emptied completely here.
The status and port names can also be read directly on the connections going into and out of the Process Group.
A number of things can be configured on the Connections. Here are a few extended explanations.
FlowFile Expiration
If you do not want FlowFiles to remain in the Connection forever, you can define a FlowFile Expiration. This is certainly not a normal case, but you can create a connection to a Funnels, for example, so that you can still see the FlowFiles routed there for some time (e.g. one day) before they are then removed.
Backpressure
The two backpressure settings relate to the number of FlowFiles and the total size of the content of all FlowFiles in the queue. If one of these limits is reached, the queue will not accept any more FlowFiles and the source Processor for this connection will no longer be executed until there is space in the queue again. The limits are soft limits and must therefore be regarded as approximate values.
The backpressure mechanism ensures that the overall system is not overloaded or that an overloaded area does not overflow. If a Processor (e.g. a database to which (e.g. a database that is being written to) can no longer accept FlowFiles, then no more should be run into it, so that the queues with backpressure continue to the source of the FlowFiles (e.g. a REST endpoint) and this then no longer accepts any calls.
Load Balance Strategy
This can only be used sensibly if IGUASU is clustered. This can then be used to explicitly distribute load to other nodes. This is only very rarely necessary, as in most cases a good distribution happens automatically.
Prioritizers
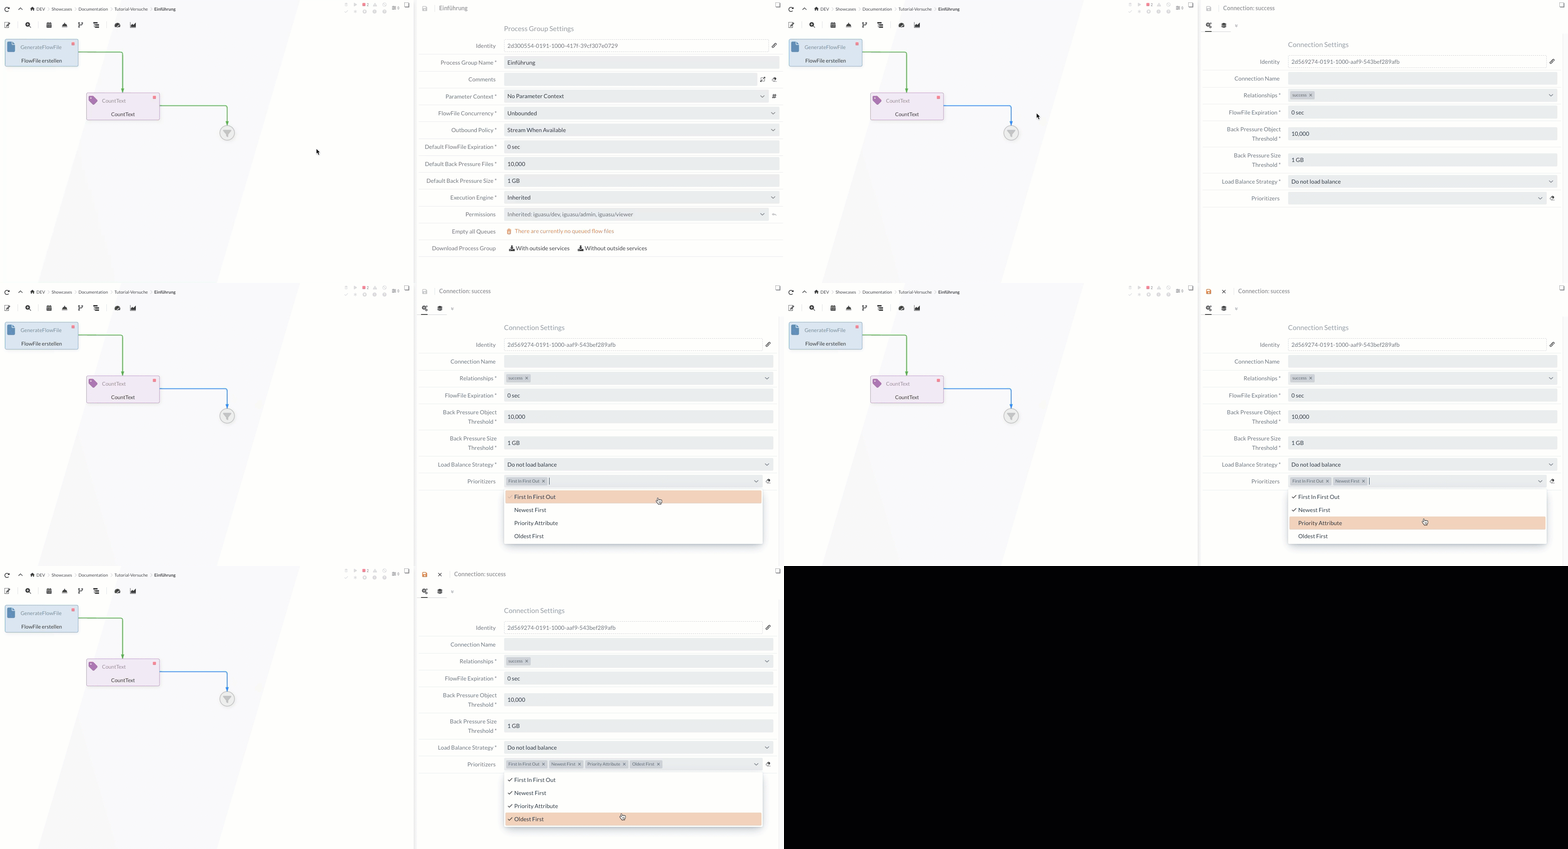
This can be used to set how the FlowFiles are located in the queue and thus also given to the following Processor. For example, if you always want the order to be the same, you would have to select "First In First Out".
The setting selected here has a direct effect on the display of the first 100 entries that can be viewed.
