Monitoring & History
IGUASU offers a look at the history of a wide variety of data.
Monitoring

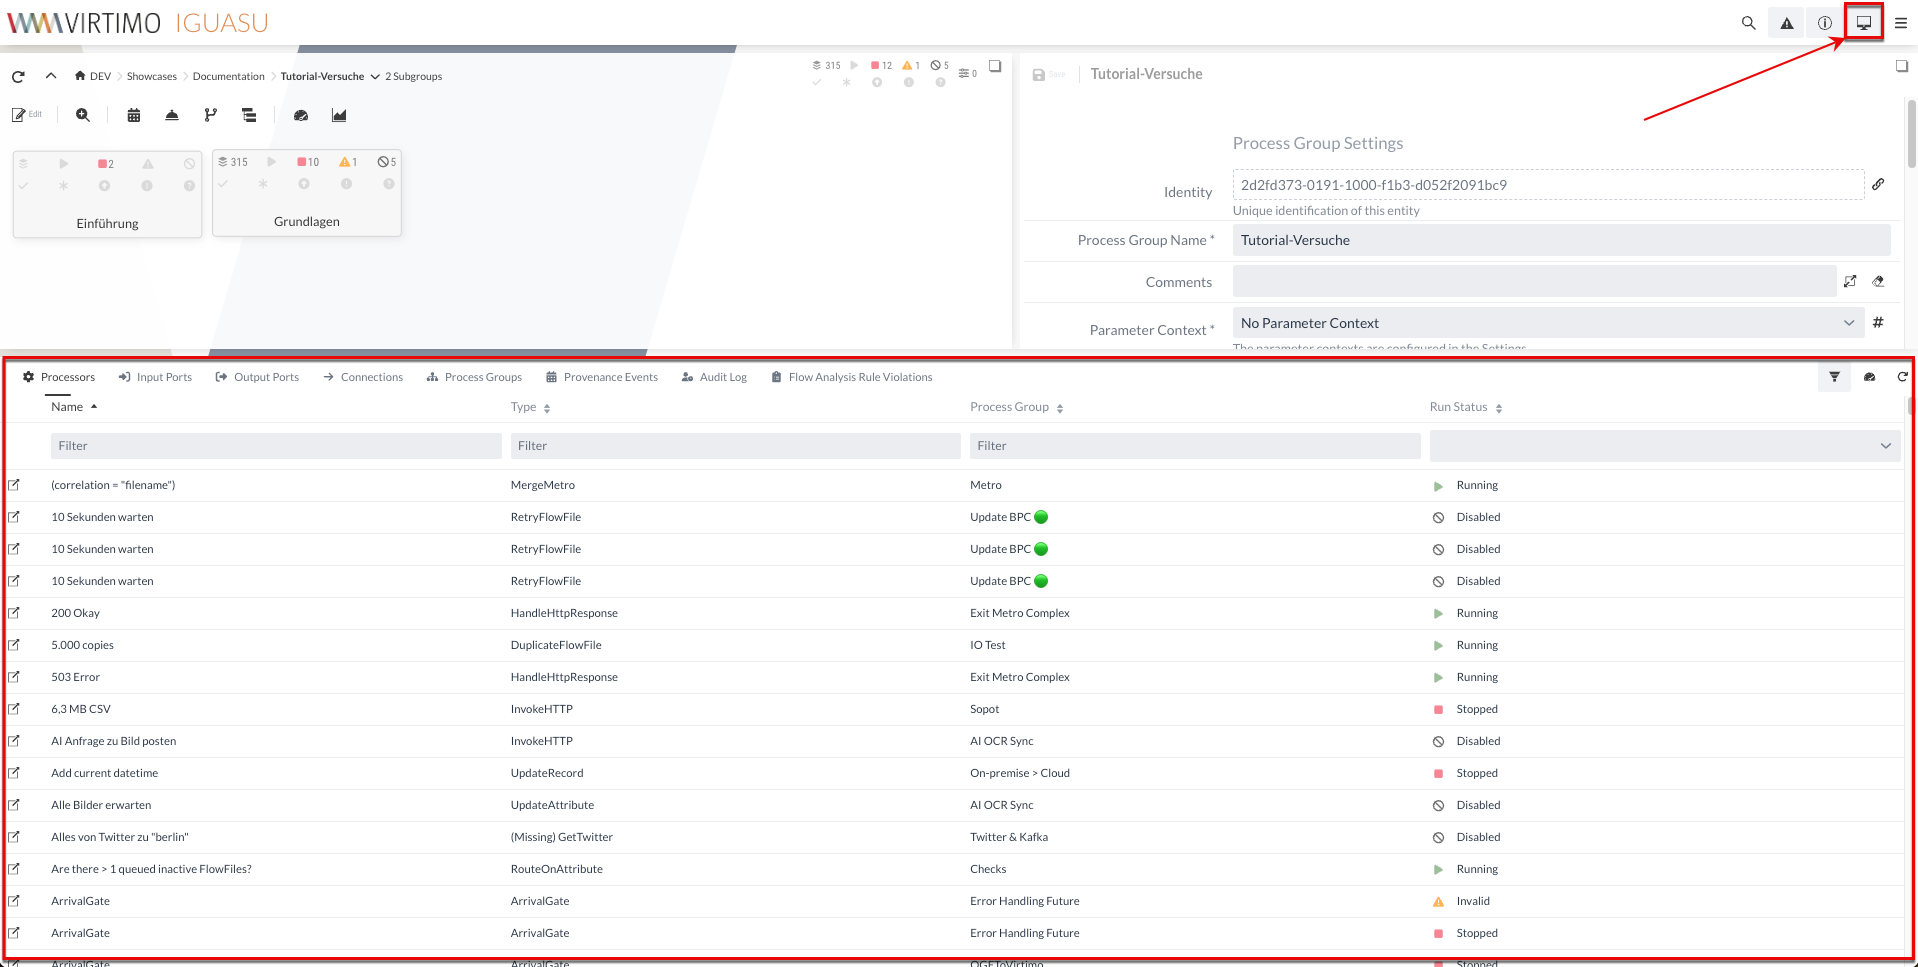
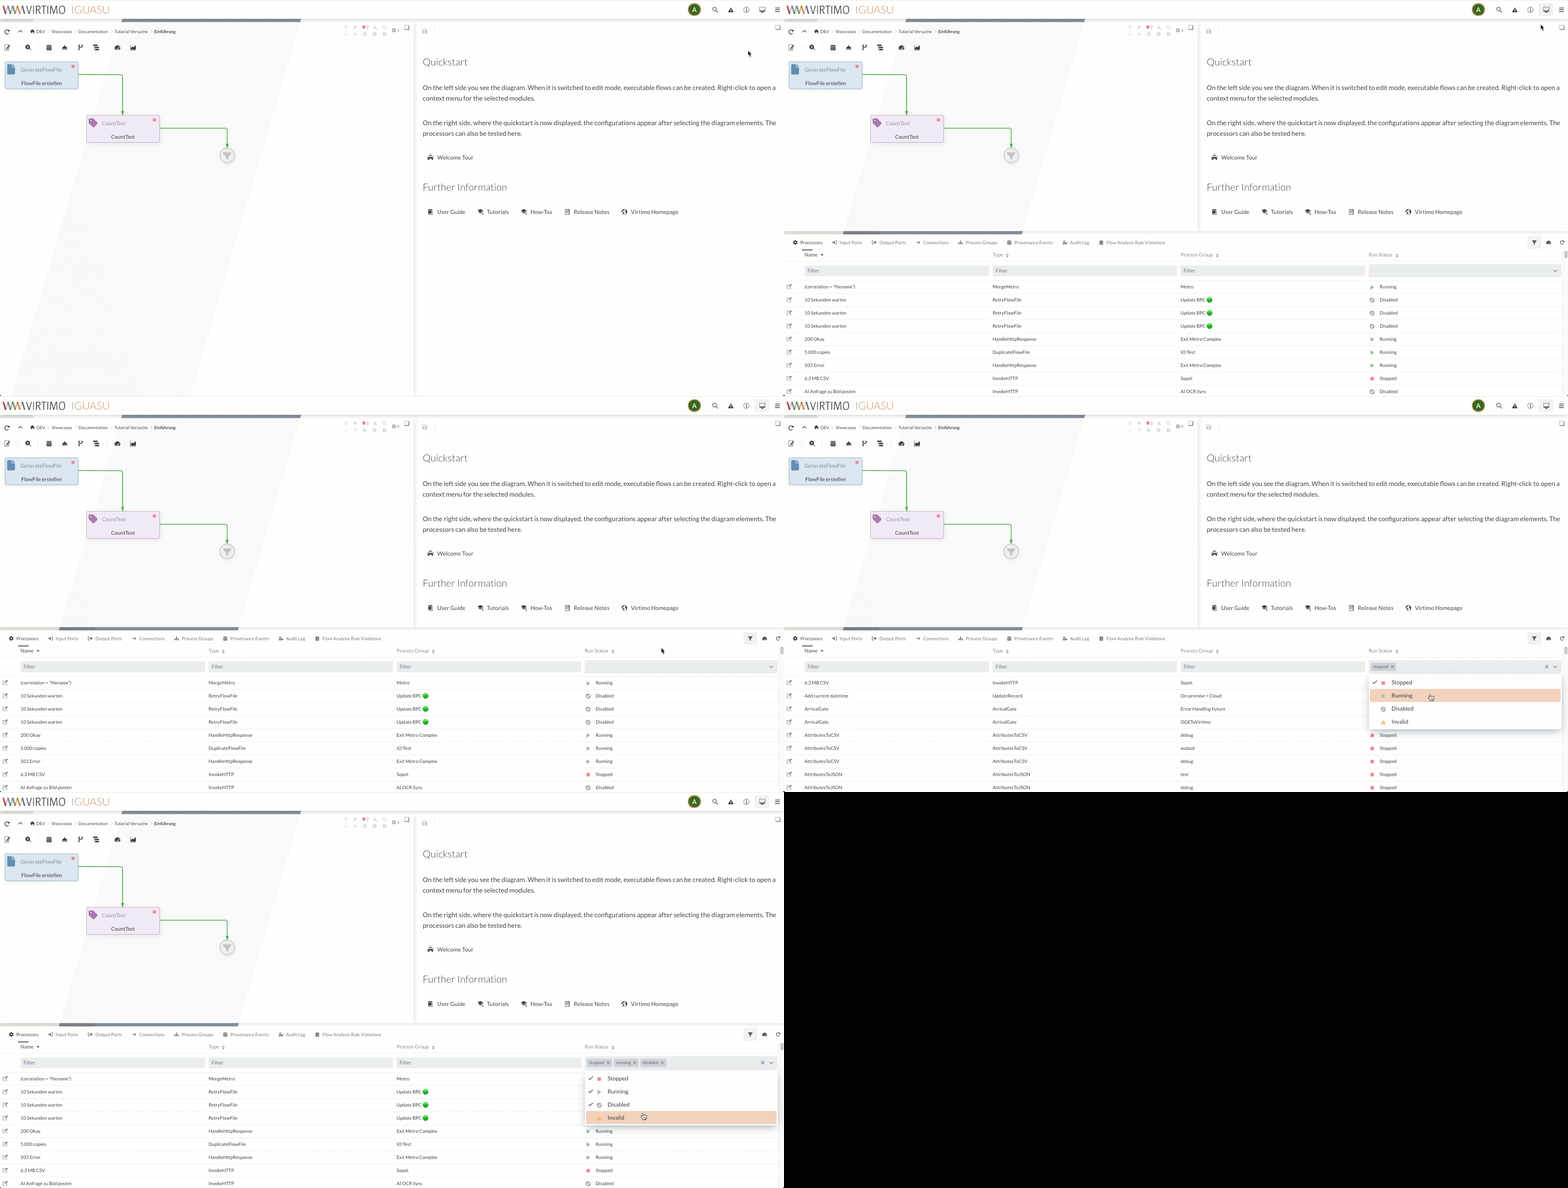
To understand how the DataFlow works at a higher level, IGUASU offers a monitoring panel. This panel can be opened via the image:icons-svg/ next to the global menu.
The summary page consists primarily of a table containing information about each of the components in the canvas. Above this table is a row that can be used to display the different component types.
The information contained in the table is the same as that provided for each component on the canvas. Each column in the table can be sorted by clicking on the column header.
Provenance Tab: Any point in a data flow where a FlowFile is processed in any way is considered a "Provenance event". Depending on the design of the data flow, different types of provenance events occur.
Audit log: The audit log contains details of the operations performed, including the Processor involved, the time of the operation and the user who performed it.
Flow Analysis Rule Violations: An overview of the components that currently violate the configured rule, see Flow Analysis Rules.
Graphical history of execution
When the Monitoring view is selected and the panel is active, certain components such as Processors, Process Group and Connection can be selected. This displays a graphical representation of the component’s statistical information over time (usually the last 5 minutes).
The component must be in a running state and should have collected some data to be able to select metrics. These metrics include information about the processing and execution of flow files, bytes, lineage and more.
Graphical history of the system
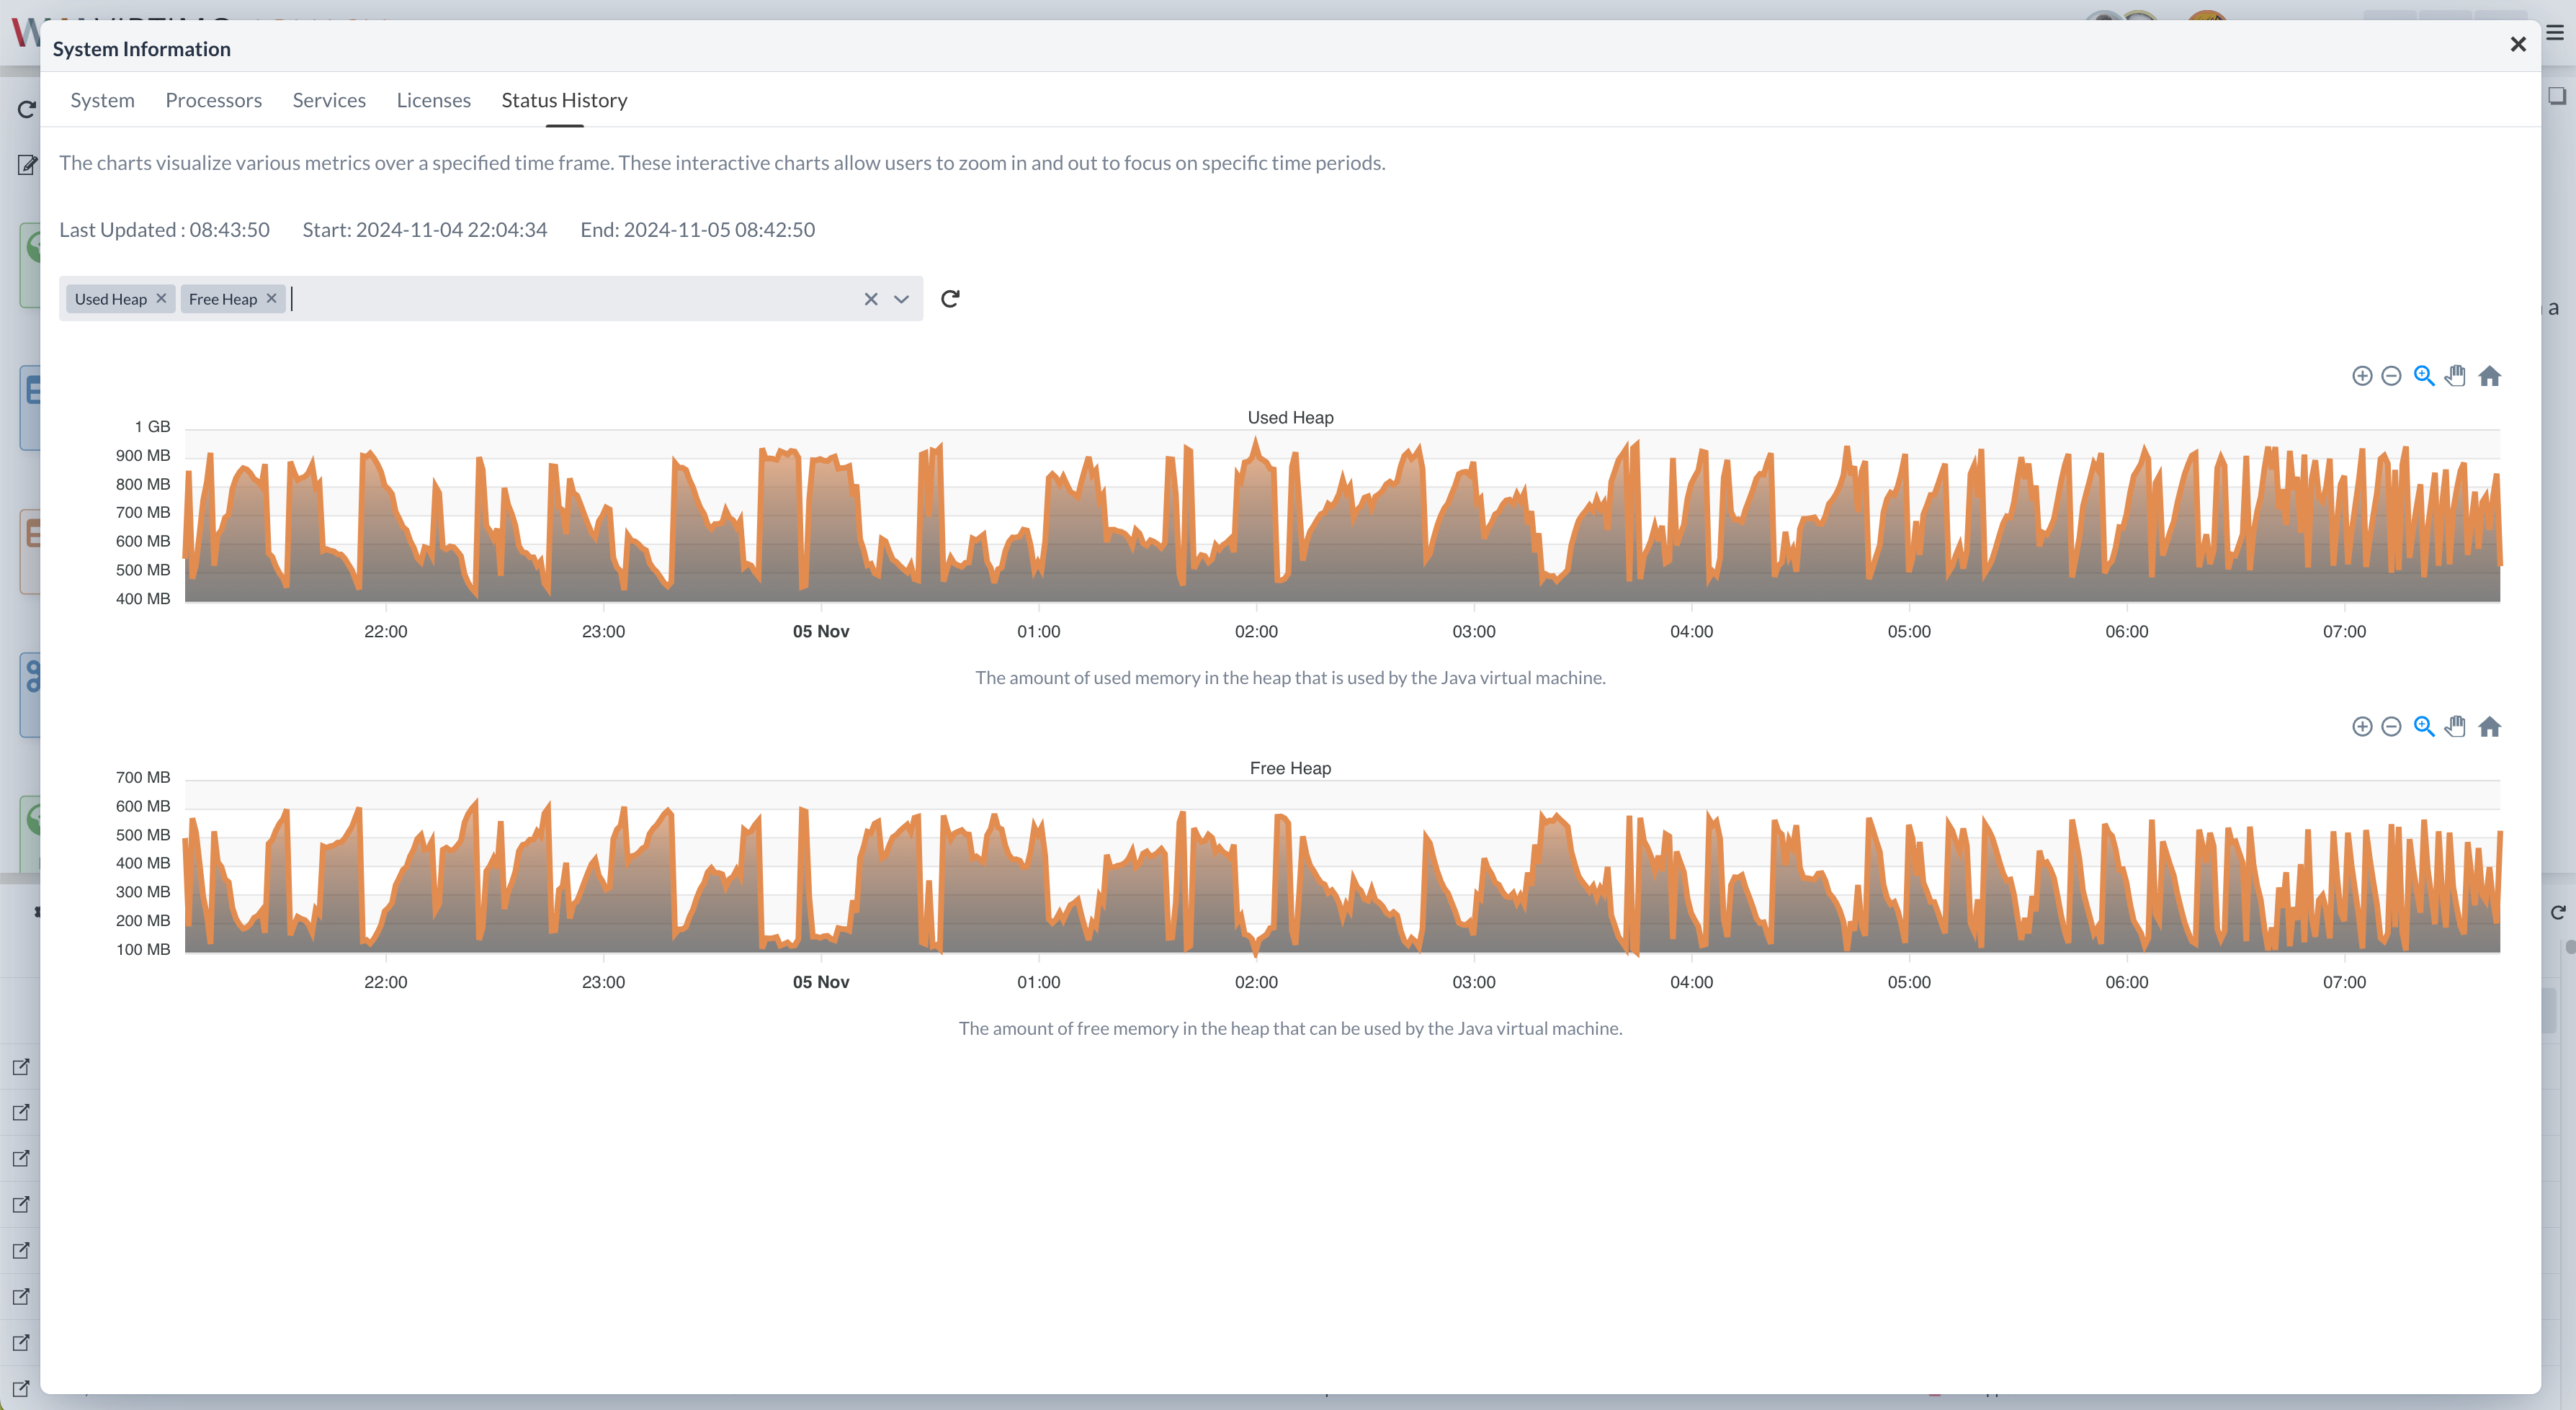
Under Global Menu > System Information > Status History, instance-specific metrics of the last 24 hours are displayed or, if the instance has been running for less time, since its start.
The status history can help with troubleshooting performance problems and provides a general overview of the state of the instance. The status history contains, among other things, information about memory usage and hard disk usage.


