Overview
VIMON is a collection of monitoring services for monitoring the systems and Services used.
It is made up of various data collectors (the exporters) and a graphical display component.
The individual components can be individually compiled and adapted depending on the use case. Components can be added, changed or removed at any time.
This allows VIMON to continuously collect data from various systems and Services and graphically display the metrics - for example from INUBIT, the BPC, databases, servers, operating systems or other third-party components.for example from INUBIT, the BPC, databases, servers, operating systems or other third-party components.
VIMON therefore contributes to improving the stability of the overall system, as
-
causes of problems can now be identified at an early stage and rectified in good time
-
Identify and monitor errors retrospectively
In the event of system failures, instead of "INUBIT is down", it is now possible to specify in more detail: "INUBIT is down because the database was unavailable from 01:35 to 01:40".
-
Derive rules to detect similar error situations and issue early warnings
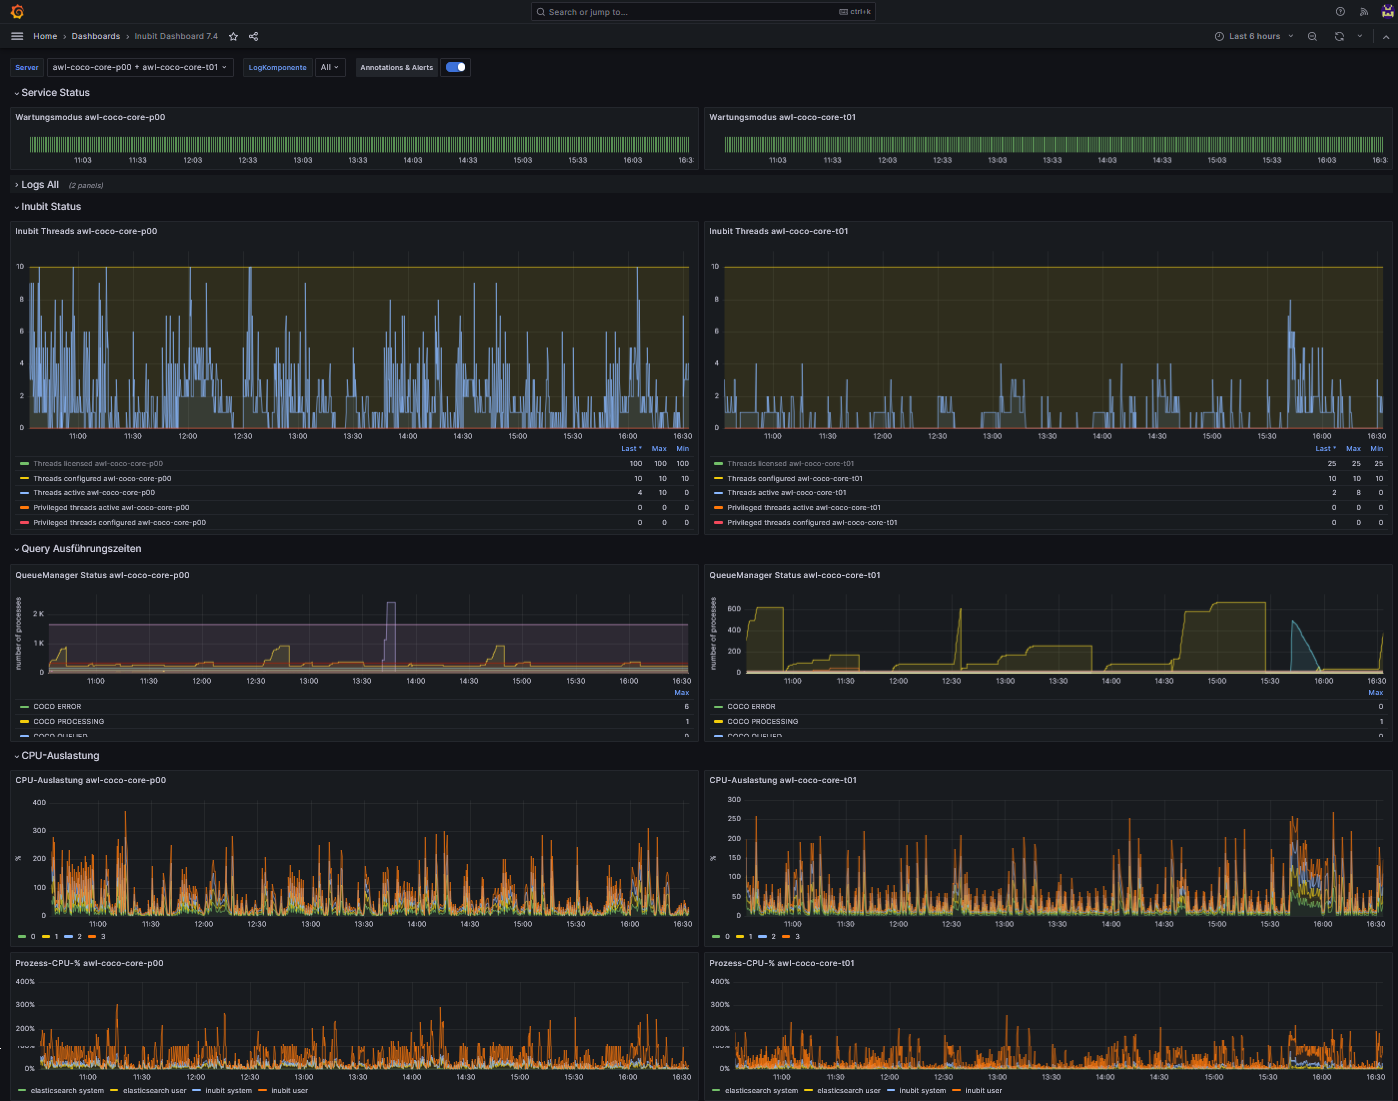
The VIMON interface visualizes the available metrics in the form of graphs that are compiled on dashboards. On request, the metrics can also be integrated into an existing monitoring tool. The interface offers the following functions, among others the following functions:
-
Any time period can be monitored, from minutes to months. This allows both short-term disruptions and long-term trends to be identified.
-
Dependencies and correlations between different metrics can be seen at a glance. This also applies across server and stage boundaries.
-
Conspicuous time periods can be viewed in more detail with one click and more details can be displayed.