Exporter
VIMON has a predetermined selection of metrics for monitoring. These metrics are collected by so-called exporters.
| Exporter | Linux | Windows |
|---|---|---|
x |
x |
|
x |
x |
|
x |
x |
|
x |
x |
|
x |
||
x |
x |
|
x |
x |
|
x |
||
x |
x |
|
x |
||
x |
x |
|
x |
||
x |
x |
|
x |
||
x |
x |
|
x |
x |
|
x |
||
x |
||
x |
x |
|
x |
||
x |
Blackbox-Exporter
The blackbox exporter is used for probing other servers and Services from the satellite node’s perspective via HTTP, HTTPS, DNS, SSH, POP, TCP, ICMP etc. This can be used, for example, to check whether an application server has a stable connection to the database or DNS server. this can be used, for example, to check whether an application server has a stable connection to the database or DNS server.
The BPC server provides the metrics via an endpoint.
The Cert-Exporter is used to monitor the validity of certificates.
You can also set an alarm to be notified before TLS certificates expire (e.g., in a reverse proxy).
The Cloudwatch exporter is used to extract values from the AWS Cloudwatch for consolidated display in the VIMON.
Exporter | Linux | Windows
| Blackbox-Exporter | x | x
| [bpc_exporter] | x | x
| [cert_exporter] | x | x
| [cloudwatch_exporter] | x | x
| File count exporter | x |
| Folder exporter | x | x
| Diskbench exporter | x | x
| Exim exporter | x |
| Grok exporter | x | x
| HAProxy exporter | x |
| ISDB exporter | x | x
| File count exporter | x |
| JavaPlugin-Exporter | x | x
| JMX-Term-Exporter | x |
| Keycloak-Exporter | x | x
| MySQL-Exporter | x | x
| Node-Exporter | x |
| Process-Exporter | x |
| Promtail | x | x
| Script-Exporter | x xml-ph-0034@deepl.i
File count exporter
The file count exporter shows Prometheus the number of files in any interface folders.
Example:
In the example interface, ~200 XML files are stored in a folder every hour, which are then read in and processed by INUBIT while maintaining the order.
The fill level should be visible in Grafana and it should be possible to set an alarm.
Hence this exporter.
It is based on the Node Exporter:
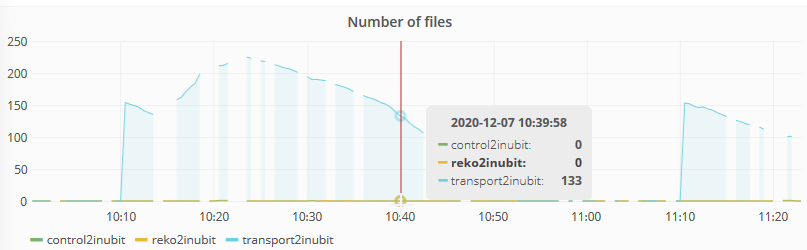
The list of folders to be monitored is configurable (here for example /control2inubit, /reko2inubit and /transport2inubit)
Diskbench exporter
The diskbench exporter can measure the write and read speed and authorization of locally and remotely mounted file systems. It cyclically writes a file of a selectable size to a directory and reads it out again. This helps identify significant speed variations and determines if processes like backups cause performance issues.
The node exporter and
Windows exporter determine how much throughput certain storage devices currently have.
However, neither measures how much is theoretically possible.
The diskbench exporter can also be used for this purpose.
Throughput checks are particularly useful in the following cases:
-
Performance-sensitive storage/storage
-
Network drives where a fluctuation in throughput is to be expected, which may have an impact on the speed or stability of the application
A file of a definable size is written when the exporter is called, then read again and the checksum checked.
The exporter then outputs the success and duration of the individual operations for each configured file.
Exim exporter
The Exim exporter is used to release mail server statistics from the Exim for monitoring.
Folder exporter
The folder exporter can be used to monitor the number of files (and folders) in desired directories. This can be used, for example, to record the fill level of transfer directories that are filled or processed by INUBIT.
Grok exporter
The Grok-Exporter can be used to read metrics from log files or to add up the number of entries in logs. It is similar to Promtail in that it also scrapes log files.
However, the Grok exporter only evaluates patterns and either returns numerical values (gauges) determined from the corresponding lines or reports that or how many lines (counters) of a certain pattern have occurred.
This can be used to determine whether certain errors/abnormalities have occurred.
On the other hand, the times of the LogDB accesses from INUBIT or the JMS queue size of the AS4 Gateway, which are written numerically in the respective logs, can also be mapped in VIMON.
HAProxy exporter
The HAProxy exporter is used to extract statistics on incoming and outgoing connections, as well as the status of backends and servers from the HAProxy.
Classically, it connects to a socket, which is why the corresponding authorizations must be set here.
|
From HAProxy version 2.0, a corresponding endpoint is included in HAProxy. This exporter is therefore no longer necessary. |
ISDB exporter
The ISDB-Exporter provides the metrics of the INUBIT REST interface for versions lower than version 7.4.0.50. It can act as a generic DB connector to measure the database availability from the perspective of the application server. It can therefore also process specialist data from the DB and provide it as a metric (for example number of incoming messages per minute). Data and statistics can be extracted from databases, but functions can also be triggered. For example, the number of incoming messages per minute).
Data and statistics can be extracted from databases, but functions can also be triggered. The exporter also measures the runtimes of the individual statements so that information about the availability and performance of the database can be determined and mapped in VIMON.
|
From version 7.4.0.50, INUBIT itself also offers Prometheus metrics via the REST Metrics interface, for example information about running, faulty and waiting processes in the queue manager, maintenance mode, etc. Only this method should be used to determine the INUBIT data! The ISDB Exporter is still used, but then only as a database exporter! |
JavaPlugin-Exporter
With the Virtimo JavaPlugin-Exporter, you can program your own plugins with Java without having to worry about the technical integration into the VIMON. The following plugins are currently available and can be added to the JavaPlugin-Exporter:
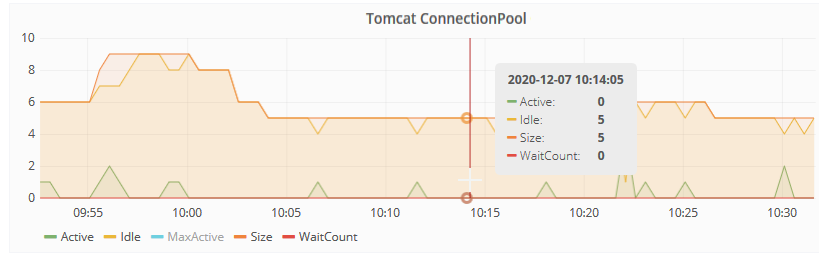
JMX-Term-Exporter
This exporter can connect to Java processes via JMX and provide internal metrics, for example Tomcat threads or DB Connection Pooling information.
It is also used to read bean information from the INUBIT Tomcat.
The exporter is based on the JMX term JAR and an adaptation of the script exporter to connect to the running INUBIT Tomcat.
It can read any beans from there.
Example:
Keycloak-Exporter
The Keycloak exporter is used to extract statistics and status information from Keycloak.
MySQL-Exporter
The MySQL-Exporter is used to extract statistics and status information from the MySQL/MariaDB.
This provides information about the daemon itself as well as about queries (for example statistics on IOWaits and locks) and sessions.
Node-Exporter
The node exporter collects basic data of the Linux operating system. It outputs various environment parameters, for example:
-
CPU utilization
-
Network throughput
-
Hard disk utilization
-
Hard disk accesses
No distinction is made between different processes.
Process-Exporter
Under Linux, the Process-Exporter extends the data of the Node-Exporter with process-specific data. It can be used to monitor individual processes or process groups for utilization and other metrics. This makes it possible, for example, to limit load peaks to processes. this also makes it possible, for example, to limit load peaks on processes.
Statistics are grouped and output for a process or process group, for example:
-
CPU load
-
Hard disk access
-
RAM
Promtail
Promtail is used to read in log files and transfer them to Loki.
Any log files can be imported into the VIMON in this way.
The time reference is therefore retained in Loki and individual log messages can be assigned to specific anomalies in the VIMON interface
In addition to log file scraping, Promtail can also act as an RSyslog server.
Script-Exporter
The script exporter is a generic exporter that is only used to call local self-written scripts and return their success, runtime and, if applicable, response.
Response.
It can therefore be used for any application, for example to return information from files or to evaluate curl with jq and therefore evaluate data from the BPC and make it available for VIMON, for example.
Windows-Exporter
The Windows exporter is the Windows counterpart to both the node exporter and the process exporter.
It exposes status values of the Windows host, for example:
-
CPU utilization
-
RAM utilization
-
Hard disk utilization
-
Network throughput
-
IO load
In addition, it also provides statistics at process/service level.