6. basic configuration
The configuration files for each VIMON component are located in the folder …/vimon/config.
These must be checked for correctness before the service is started for the first time.
HAProxy
To avoid having to release the ports of all exporters on each satellite node, a HAProxy takes over port forwarding via the "VIMON Port" 9443.
Depending on the specific Linux distribution, the correct HAProxy must be selected via a symlink. If the default HAProxy does not start, you can test the others as follows:
-
Navigate to the HAProxy directory.
cd vimon/haproxy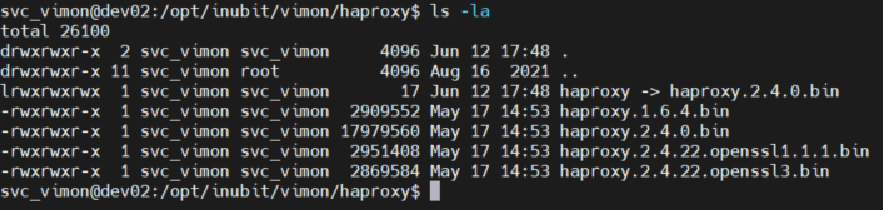
-
Remove the HAProxy symlink.
rm haproxy -
Create a symlink.
ln -s haproxy.2.4.22.openssl3.bin haproxy -
Stop VIMON service
sudo systemctl stop vimon.service -
Start VIMON service
sudo systemctl start vimon.service
Prometheus
The configuration is carried out via two files:
-
vimon/config/prometheus/prometheus.yml
contains the scrape configurationsHere you can set which exporters are to be retrieved and how often, whether an auth is to be used or whether any data manipulations are to be carried out.
-
vimon/config/prometheus/prometheus.conf
Configuration of retentionA maximum period or a maximum data size is configured here.
The oldest data is removed when the maximum period or the maximum file size is reached.
The delivered prometheus.yml already contains some standard scrape jobs that must be adapted to the local conditions.
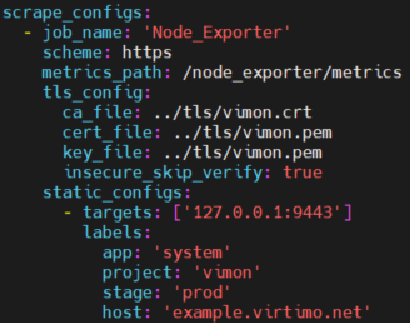
A corresponding configuration must be created here for each node for each exporter.
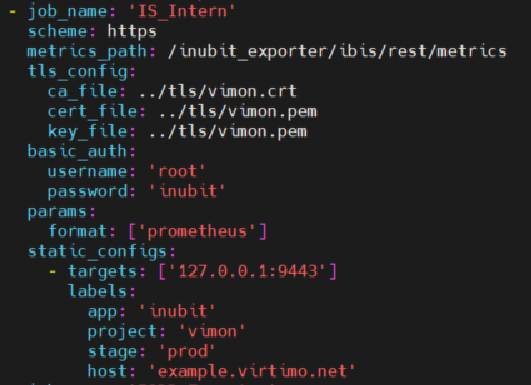
In the static_configs section, you can set which node is monitored and how the metric should be "named" (see lables).
For the INUBIT REST endpoint job, the INUBIT access data must also be stored here initially:
|
You can use the |
The VIMON service must be restarted after every change to prometheus.yml:
-
Stop VIMON service
sudo systemctl stop vimon.service -
Start VIMON service
sudo systemctl start vimon.service
Display status in the frontend
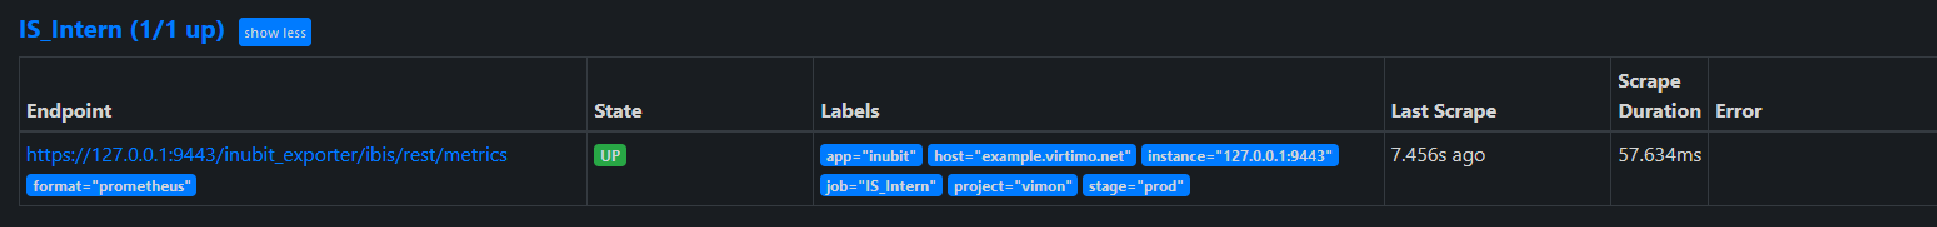
You can view the Prometheus status in the frontend.
-
Set up Port Forwarding for Port 9090.
-
Open the following URL in the browser:
https://localhost:9090/targets
Now you can see the current status of each scrape_config from prometheus.yml, the image shows the INUBIT REST Connector as an example: