Grafana
Grafana ist die Web-Visualisierungskomponente in VIMON. Hier können Dashboards angelegt und die enthaltenen Panels mit Diagrammen, Tabellen und weiteren Anzeigetypen gefüllt werden.
Die Konfiguration erfolgt über die Datei vimon/config/grafana/grafana_custom.ini.
Hier werden vom Default abweichende Parameter definiert.
Ein Einblick in alle aktuell möglichen Parameter und deren Default erhalten Sie in der Datei vimon/grafana/conf/defaults.ini.
Soll ein Parameter hiervon geändert werden, ist dieser in die grafana_custom.ini zu übernehmen und dort ebenfalls zu ändern.
BPC-Anbindung
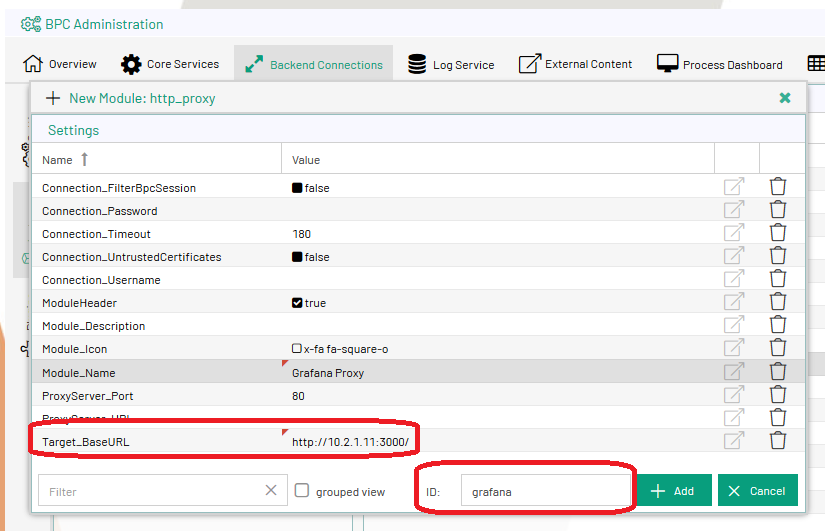
Um Grafana in das BPC einzubinden, können entweder einzelne Diagramme oder ganze Dashboards eingebettet werden.
Hierfür kommt eine Kombination aus Backend-Proxy und dem BPC Modul External Content zum Einsatz.
-
Backend-Proxy anlegen.
-
Grafana-URL und Proxy-ID beachten: Die ID muss
grafanaheißen, da Grafana darauf besteht, dass seine root-URL mitgrafanaendet (siehe Grafana-Dokumentation)Die URL muss immer mit einem "/" enden.
-
-
External Content-Modulkomponente erstellen.
-
Proxy aktivieren und auswählen
-
Module-Header deaktivieren
-
BaseURLleer lassen -
Target_Pathauf "/" oder direkt auf ein Dashboard setzen (URL kann im Grafana viaShare Dashboarderzeugt werden)Der Zielpfad muss immer mit einem "/" beginnen.
Die ID muss einzigartig sein, darf also nicht wieder auf
grafanagesetzt werden.
-
-
Anpassungen im Grafana (
grafana/config>grafana.ini/default.ini) vornehmen.-
default_theme:lightsetzt das helle Theme als Standard -
allow_embedding:trueerlaubt das Einbinden von Grafana ins BPC -
auth.anonymous: aktiviert den Zugriff auf eine Standard-Organisation ohne Login, sonst muss man sich im BPC Modul erneut anmeldenenabled = true org_name = <Euer Organisationsname> -
root_url: wird über die folgende Vorlage gebildet:%(protocol)s://%(domain)s:%(http_port)s/cxf/bpc-httpproxy/httpProxy/grafana/
-
-
Grafana neustarten
Beispiel-Dashboards
Virtimo-Board
{
"annotations": {
"list": [
{
"builtIn": 1,
"datasource": "-- Grafana --",
"enable": true,
"hide": true,
"iconColor": "rgba(0, 211, 255, 1)",
"name": "Annotations & Alerts",
"type": "dashboard"
},
{
"datasource": "manuelle Bemerkungen",
"enable": false,
"hide": false,
"iconColor": "rgba(255, 96, 96, 1)",
"limit": 100,
"name": "manuelle Bemerkungen",
"queries": [
{
"date": "2018-02-12T11:03:49.000Z",
"text": "Testkommentar"
}
],
"showIn": 0,
"tags": [],
"type": "tags"
}
]
},
"editable": true,
"gnetId": null,
"graphTooltip": 0,
"hideControls": false,
"id": 6,
"links": [],
"refresh": "30s",
"rows": [
{
"collapse": false,
"height": 230,
"panels": [
{
"aliasColors": {
"ERROR": "#890f02",
"PROCESSING": "#508642",
"QUEUED": "#e5ac0e",
"SUSPEND": "#6ed0e0",
"WAITING": "#d683ce",
"queuemgr_error": "#bf1b00",
"queuemgr_processing": "#508642",
"queuemgr_queued": "#e5ac0e",
"queuemgr_suspend": "#f9d9f9",
"queuemgr_waiting": "#447ebc"
},
"bars": false,
"dashLength": 10,
"dashes": false,
"datasource": null,
"decimals": 1,
"fill": 1,
"id": 4,
"legend": {
"alignAsTable": true,
"avg": false,
"current": false,
"max": true,
"min": false,
"rightSide": false,
"show": true,
"total": false,
"values": true
},
"lines": true,
"linewidth": 1,
"links": [],
"nullPointMode": "null",
"percentage": false,
"pointradius": 5,
"points": false,
"renderer": "flot",
"repeat": "Server",
"scopedVars": {
"Server": {
"selected": false,
"text": "GRTD-PreProd",
"value": "GRTD-PreProd"
}
},
"seriesOverrides": [],
"spaceLength": 10,
"span": 4,
"stack": false,
"steppedLine": false,
"targets": [
{
"expr": "dbse_resultValue{db=\"$Server\",statement=~\"queuemgr_waiting|queuemgr_processing|queuemgr_queued\"}",
"format": "time_series",
"intervalFactor": 1,
"legendFormat": "{{statement}}",
"refId": "B"
}
],
"thresholds": [],
"timeFrom": null,
"timeShift": null,
"title": "QueueManager Status $Server",
"tooltip": {
"shared": true,
"sort": 0,
"value_type": "individual"
},
"type": "graph",
"xaxis": {
"buckets": null,
"mode": "time",
"name": null,
"show": true,
"values": []
},
"yaxes": [
{
"decimals": 0,
"format": "short",
"label": "number of processes",
"logBase": 1,
"max": null,
"min": "0",
"show": true
},
{
"format": "short",
"label": null,
"logBase": 1,
"max": null,
"min": null,
"show": false
}
]
},
{
"aliasColors": {
"ERROR": "#890f02",
"PROCESSING": "#508642",
"QUEUED": "#e5ac0e",
"SUSPEND": "#6ed0e0",
"WAITING": "#d683ce",
"queuemgr_error": "#bf1b00",
"queuemgr_processing": "#508642",
"queuemgr_queued": "#e5ac0e",
"queuemgr_suspend": "#f9d9f9",
"queuemgr_waiting": "#447ebc"
},
"bars": false,
"dashLength": 10,
"dashes": false,
"datasource": null,
"decimals": 1,
"fill": 1,
"id": 54,
"legend": {
"alignAsTable": true,
"avg": false,
"current": false,
"max": true,
"min": false,
"rightSide": false,
"show": true,
"total": false,
"values": true
},
"lines": true,
"linewidth": 1,
"links": [],
"nullPointMode": "null",
"percentage": false,
"pointradius": 5,
"points": false,
"renderer": "flot",
"repeat": null,
"repeatIteration": 1575468522162,
"repeatPanelId": 4,
"scopedVars": {
"Server": {
"selected": false,
"text": "GRTD-Prod",
"value": "GRTD-Prod"
}
},
"seriesOverrides": [],
"spaceLength": 10,
"span": 4,
"stack": false,
"steppedLine": false,
"targets": [
{
"expr": "dbse_resultValue{db=\"$Server\",statement=~\"queuemgr_waiting|queuemgr_processing|queuemgr_queued\"}",
"format": "time_series",
"intervalFactor": 1,
"legendFormat": "{{statement}}",
"refId": "B"
}
],
"thresholds": [],
"timeFrom": null,
"timeShift": null,
"title": "QueueManager Status $Server",
"tooltip": {
"shared": true,
"sort": 0,
"value_type": "individual"
},
"type": "graph",
"xaxis": {
"buckets": null,
"mode": "time",
"name": null,
"show": true,
"values": []
},
"yaxes": [
{
"decimals": 0,
"format": "short",
"label": "number of processes",
"logBase": 1,
"max": null,
"min": "0",
"show": true
},
{
"format": "short",
"label": null,
"logBase": 1,
"max": null,
"min": null,
"show": false
}
]
},
{
"aliasColors": {
"ERROR": "#890f02",
"PROCESSING": "#508642",
"QUEUED": "#e5ac0e",
"SUSPEND": "#6ed0e0",
"WAITING": "#d683ce",
"queuemgr_error": "#bf1b00",
"queuemgr_processing": "#508642",
"queuemgr_queued": "#e5ac0e",
"queuemgr_suspend": "#f9d9f9",
"queuemgr_waiting": "#447ebc"
},
"bars": false,
"dashLength": 10,
"dashes": false,
"datasource": null,
"decimals": 1,
"fill": 1,
"id": 55,
"legend": {
"alignAsTable": true,
"avg": false,
"current": false,
"max": true,
"min": false,
"rightSide": false,
"show": true,
"total": false,
"values": true
},
"lines": true,
"linewidth": 1,
"links": [],
"nullPointMode": "null",
"percentage": false,
"pointradius": 5,
"points": false,
"renderer": "flot",
"repeat": null,
"repeatIteration": 1575468522162,
"repeatPanelId": 4,
"scopedVars": {
"Server": {
"selected": false,
"text": "GRTD-Test",
"value": "GRTD-Test"
}
},
"seriesOverrides": [],
"spaceLength": 10,
"span": 4,
"stack": false,
"steppedLine": false,
"targets": [
{
"expr": "dbse_resultValue{db=\"$Server\",statement=~\"queuemgr_waiting|queuemgr_processing|queuemgr_queued\"}",
"format": "time_series",
"intervalFactor": 1,
"legendFormat": "{{statement}}",
"refId": "B"
}
],
"thresholds": [],
"timeFrom": null,
"timeShift": null,
"title": "QueueManager Status $Server",
"tooltip": {
"shared": true,
"sort": 0,
"value_type": "individual"
},
"type": "graph",
"xaxis": {
"buckets": null,
"mode": "time",
"name": null,
"show": true,
"values": []
},
"yaxes": [
{
"decimals": 0,
"format": "short",
"label": "number of processes",
"logBase": 1,
"max": null,
"min": "0",
"show": true
},
{
"format": "short",
"label": null,
"logBase": 1,
"max": null,
"min": null,
"show": false
}
]
}
],
"repeat": null,
"repeatIteration": null,
"repeatRowId": null,
"showTitle": true,
"title": "Queue Manager Status",
"titleSize": "h6"
},
{
"collapse": false,
"height": "250px",
"panels": [
{
"aliasColors": {},
"bars": false,
"dashLength": 10,
"dashes": false,
"datasource": "lokaler Prometheus",
"fill": 1,
"id": 1,
"legend": {
"avg": false,
"current": false,
"max": false,
"min": false,
"show": true,
"total": false,
"values": false
},
"lines": true,
"linewidth": 1,
"links": [],
"nullPointMode": "null",
"percentage": false,
"pointradius": 5,
"points": false,
"renderer": "flot",
"repeat": "Server",
"scopedVars": {
"Server": {
"selected": false,
"text": "GRTD-PreProd",
"value": "GRTD-PreProd"
}
},
"seriesOverrides": [],
"spaceLength": 10,
"span": 4,
"stack": false,
"steppedLine": false,
"targets": [
{
"expr": "100 - (irate(node_cpu{job=\"$Server\",mode=\"idle\"}[5m]) * 100)",
"format": "time_series",
"intervalFactor": 1,
"legendFormat": "{{cpu}}",
"refId": "A"
}
],
"thresholds": [],
"timeFrom": null,
"timeShift": null,
"title": "CPU-Auslastung $Server",
"tooltip": {
"shared": true,
"sort": 0,
"value_type": "individual"
},
"type": "graph",
"xaxis": {
"buckets": null,
"mode": "time",
"name": null,
"show": true,
"values": []
},
"yaxes": [
{
"format": "short",
"label": "%",
"logBase": 1,
"max": "100",
"min": "0",
"show": true
},
{
"format": "short",
"label": null,
"logBase": 1,
"max": null,
"min": null,
"show": true
}
]
},
{
"aliasColors": {},
"bars": false,
"dashLength": 10,
"dashes": false,
"datasource": "lokaler Prometheus",
"fill": 1,
"id": 56,
"legend": {
"avg": false,
"current": false,
"max": false,
"min": false,
"show": true,
"total": false,
"values": false
},
"lines": true,
"linewidth": 1,
"links": [],
"nullPointMode": "null",
"percentage": false,
"pointradius": 5,
"points": false,
"renderer": "flot",
"repeat": null,
"repeatIteration": 1575468522162,
"repeatPanelId": 1,
"scopedVars": {
"Server": {
"selected": false,
"text": "GRTD-Prod",
"value": "GRTD-Prod"
}
},
"seriesOverrides": [],
"spaceLength": 10,
"span": 4,
"stack": false,
"steppedLine": false,
"targets": [
{
"expr": "100 - (irate(node_cpu{job=\"$Server\",mode=\"idle\"}[5m]) * 100)",
"format": "time_series",
"intervalFactor": 1,
"legendFormat": "{{cpu}}",
"refId": "A"
}
],
"thresholds": [],
"timeFrom": null,
"timeShift": null,
"title": "CPU-Auslastung $Server",
"tooltip": {
"shared": true,
"sort": 0,
"value_type": "individual"
},
"type": "graph",
"xaxis": {
"buckets": null,
"mode": "time",
"name": null,
"show": true,
"values": []
},
"yaxes": [
{
"format": "short",
"label": "%",
"logBase": 1,
"max": "100",
"min": "0",
"show": true
},
{
"format": "short",
"label": null,
"logBase": 1,
"max": null,
"min": null,
"show": true
}
]
},
{
"aliasColors": {},
"bars": false,
"dashLength": 10,
"dashes": false,
"datasource": "lokaler Prometheus",
"fill": 1,
"id": 57,
"legend": {
"avg": false,
"current": false,
"max": false,
"min": false,
"show": true,
"total": false,
"values": false
},
"lines": true,
"linewidth": 1,
"links": [],
"nullPointMode": "null",
"percentage": false,
"pointradius": 5,
"points": false,
"renderer": "flot",
"repeat": null,
"repeatIteration": 1575468522162,
"repeatPanelId": 1,
"scopedVars": {
"Server": {
"selected": false,
"text": "GRTD-Test",
"value": "GRTD-Test"
}
},
"seriesOverrides": [],
"spaceLength": 10,
"span": 4,
"stack": false,
"steppedLine": false,
"targets": [
{
"expr": "100 - (irate(node_cpu{job=\"$Server\",mode=\"idle\"}[5m]) * 100)",
"format": "time_series",
"intervalFactor": 1,
"legendFormat": "{{cpu}}",
"refId": "A"
}
],
"thresholds": [],
"timeFrom": null,
"timeShift": null,
"title": "CPU-Auslastung $Server",
"tooltip": {
"shared": true,
"sort": 0,
"value_type": "individual"
},
"type": "graph",
"xaxis": {
"buckets": null,
"mode": "time",
"name": null,
"show": true,
"values": []
},
"yaxes": [
{
"format": "short",
"label": "%",
"logBase": 1,
"max": "100",
"min": "0",
"show": true
},
{
"format": "short",
"label": null,
"logBase": 1,
"max": null,
"min": null,
"show": true
}
]
}
],
"repeat": null,
"repeatIteration": null,
"repeatRowId": null,
"showTitle": true,
"title": "CPU-Auslastung",
"titleSize": "h6"
},
{
"collapse": false,
"height": 250,
"panels": [
{
"aliasColors": {},
"bars": false,
"dashLength": 10,
"dashes": false,
"datasource": "lokaler Prometheus",
"fill": 1,
"id": 43,
"legend": {
"avg": false,
"current": false,
"max": false,
"min": false,
"show": true,
"total": false,
"values": false
},
"lines": true,
"linewidth": 1,
"links": [],
"nullPointMode": "null",
"percentage": false,
"pointradius": 5,
"points": false,
"renderer": "flot",
"repeat": "Server",
"scopedVars": {
"Server": {
"selected": false,
"text": "GRTD-PreProd",
"value": "GRTD-PreProd"
}
},
"seriesOverrides": [],
"spaceLength": 10,
"span": 4,
"stack": false,
"steppedLine": false,
"targets": [
{
"expr": "irate(namedprocess_namegroup_cpu_seconds_total{job=\"$Server\"}[30s])",
"format": "time_series",
"intervalFactor": 1,
"legendFormat": "{{groupname}} {{mode}}",
"refId": "A"
}
],
"thresholds": [],
"timeFrom": null,
"timeShift": null,
"title": "CPU-Sekunden $Server",
"tooltip": {
"shared": true,
"sort": 0,
"value_type": "individual"
},
"type": "graph",
"xaxis": {
"buckets": null,
"mode": "time",
"name": null,
"show": true,
"values": []
},
"yaxes": [
{
"format": "short",
"label": null,
"logBase": 1,
"max": null,
"min": null,
"show": true
},
{
"format": "short",
"label": null,
"logBase": 1,
"max": null,
"min": null,
"show": true
}
]
},
{
"aliasColors": {},
"bars": false,
"dashLength": 10,
"dashes": false,
"datasource": "lokaler Prometheus",
"fill": 1,
"id": 58,
"legend": {
"avg": false,
"current": false,
"max": false,
"min": false,
"show": true,
"total": false,
"values": false
},
"lines": true,
"linewidth": 1,
"links": [],
"nullPointMode": "null",
"percentage": false,
"pointradius": 5,
"points": false,
"renderer": "flot",
"repeat": null,
"repeatIteration": 1575468522162,
"repeatPanelId": 43,
"scopedVars": {
"Server": {
"selected": false,
"text": "GRTD-Prod",
"value": "GRTD-Prod"
}
},
"seriesOverrides": [],
"spaceLength": 10,
"span": 4,
"stack": false,
"steppedLine": false,
"targets": [
{
"expr": "irate(namedprocess_namegroup_cpu_seconds_total{job=\"$Server\"}[30s])",
"format": "time_series",
"intervalFactor": 1,
"legendFormat": "{{groupname}} {{mode}}",
"refId": "A"
}
],
"thresholds": [],
"timeFrom": null,
"timeShift": null,
"title": "CPU-Sekunden $Server",
"tooltip": {
"shared": true,
"sort": 0,
"value_type": "individual"
},
"type": "graph",
"xaxis": {
"buckets": null,
"mode": "time",
"name": null,
"show": true,
"values": []
},
"yaxes": [
{
"format": "short",
"label": null,
"logBase": 1,
"max": null,
"min": null,
"show": true
},
{
"format": "short",
"label": null,
"logBase": 1,
"max": null,
"min": null,
"show": true
}
]
},
{
"aliasColors": {},
"bars": false,
"dashLength": 10,
"dashes": false,
"datasource": "lokaler Prometheus",
"fill": 1,
"id": 59,
"legend": {
"avg": false,
"current": false,
"max": false,
"min": false,
"show": true,
"total": false,
"values": false
},
"lines": true,
"linewidth": 1,
"links": [],
"nullPointMode": "null",
"percentage": false,
"pointradius": 5,
"points": false,
"renderer": "flot",
"repeat": null,
"repeatIteration": 1575468522162,
"repeatPanelId": 43,
"scopedVars": {
"Server": {
"selected": false,
"text": "GRTD-Test",
"value": "GRTD-Test"
}
},
"seriesOverrides": [],
"spaceLength": 10,
"span": 4,
"stack": false,
"steppedLine": false,
"targets": [
{
"expr": "irate(namedprocess_namegroup_cpu_seconds_total{job=\"$Server\"}[30s])",
"format": "time_series",
"intervalFactor": 1,
"legendFormat": "{{groupname}} {{mode}}",
"refId": "A"
}
],
"thresholds": [],
"timeFrom": null,
"timeShift": null,
"title": "CPU-Sekunden $Server",
"tooltip": {
"shared": true,
"sort": 0,
"value_type": "individual"
},
"type": "graph",
"xaxis": {
"buckets": null,
"mode": "time",
"name": null,
"show": true,
"values": []
},
"yaxes": [
{
"format": "short",
"label": null,
"logBase": 1,
"max": null,
"min": null,
"show": true
},
{
"format": "short",
"label": null,
"logBase": 1,
"max": null,
"min": null,
"show": true
}
]
}
],
"repeat": null,
"repeatIteration": null,
"repeatRowId": null,
"showTitle": true,
"title": "CPU-Zeit",
"titleSize": "h6"
},
{
"collapse": false,
"height": 250,
"panels": [
{
"aliasColors": {},
"bars": false,
"dashLength": 10,
"dashes": false,
"datasource": null,
"fill": 1,
"id": 3,
"legend": {
"avg": false,
"current": false,
"max": false,
"min": false,
"show": true,
"total": false,
"values": false
},
"lines": true,
"linewidth": 1,
"links": [],
"nullPointMode": "null",
"percentage": false,
"pointradius": 5,
"points": false,
"renderer": "flot",
"repeat": "Server",
"scopedVars": {
"Server": {
"selected": false,
"text": "GRTD-PreProd",
"value": "GRTD-PreProd"
}
},
"seriesOverrides": [
{
"alias": "syslog_count_value",
"yaxis": 2
}
],
"spaceLength": 10,
"span": 4,
"stack": false,
"steppedLine": false,
"targets": [
{
"expr": "dbse_executionTime_nanos{job=\"$Server\"}/1000000",
"format": "time_series",
"intervalFactor": 1,
"legendFormat": "{{statement}}",
"refId": "A"
},
{
"expr": "dbse_resultValue{job=\"$Server\", statement!=\"1_from_dual\"}",
"format": "time_series",
"intervalFactor": 1,
"legendFormat": "{{statement}}_value",
"refId": "B"
}
],
"thresholds": [],
"timeFrom": null,
"timeShift": null,
"title": "Query Ausführungszeiten $Server",
"tooltip": {
"shared": true,
"sort": 0,
"value_type": "individual"
},
"type": "graph",
"xaxis": {
"buckets": null,
"mode": "time",
"name": null,
"show": true,
"values": []
},
"yaxes": [
{
"format": "ms",
"label": null,
"logBase": 1,
"max": null,
"min": "0",
"show": true
},
{
"format": "short",
"label": null,
"logBase": 1,
"max": null,
"min": null,
"show": true
}
]
},
{
"aliasColors": {},
"bars": false,
"dashLength": 10,
"dashes": false,
"datasource": null,
"fill": 1,
"id": 60,
"legend": {
"avg": false,
"current": false,
"max": false,
"min": false,
"show": true,
"total": false,
"values": false
},
"lines": true,
"linewidth": 1,
"links": [],
"nullPointMode": "null",
"percentage": false,
"pointradius": 5,
"points": false,
"renderer": "flot",
"repeat": null,
"repeatIteration": 1575468522162,
"repeatPanelId": 3,
"scopedVars": {
"Server": {
"selected": false,
"text": "GRTD-Prod",
"value": "GRTD-Prod"
}
},
"seriesOverrides": [
{
"alias": "syslog_count_value",
"yaxis": 2
}
],
"spaceLength": 10,
"span": 4,
"stack": false,
"steppedLine": false,
"targets": [
{
"expr": "dbse_executionTime_nanos{job=\"$Server\"}/1000000",
"format": "time_series",
"intervalFactor": 1,
"legendFormat": "{{statement}}",
"refId": "A"
},
{
"expr": "dbse_resultValue{job=\"$Server\", statement!=\"1_from_dual\"}",
"format": "time_series",
"intervalFactor": 1,
"legendFormat": "{{statement}}_value",
"refId": "B"
}
],
"thresholds": [],
"timeFrom": null,
"timeShift": null,
"title": "Query Ausführungszeiten $Server",
"tooltip": {
"shared": true,
"sort": 0,
"value_type": "individual"
},
"type": "graph",
"xaxis": {
"buckets": null,
"mode": "time",
"name": null,
"show": true,
"values": []
},
"yaxes": [
{
"format": "ms",
"label": null,
"logBase": 1,
"max": null,
"min": "0",
"show": true
},
{
"format": "short",
"label": null,
"logBase": 1,
"max": null,
"min": null,
"show": true
}
]
},
{
"aliasColors": {},
"bars": false,
"dashLength": 10,
"dashes": false,
"datasource": null,
"fill": 1,
"id": 61,
"legend": {
"avg": false,
"current": false,
"max": false,
"min": false,
"show": true,
"total": false,
"values": false
},
"lines": true,
"linewidth": 1,
"links": [],
"nullPointMode": "null",
"percentage": false,
"pointradius": 5,
"points": false,
"renderer": "flot",
"repeat": null,
"repeatIteration": 1575468522162,
"repeatPanelId": 3,
"scopedVars": {
"Server": {
"selected": false,
"text": "GRTD-Test",
"value": "GRTD-Test"
}
},
"seriesOverrides": [
{
"alias": "syslog_count_value",
"yaxis": 2
}
],
"spaceLength": 10,
"span": 4,
"stack": false,
"steppedLine": false,
"targets": [
{
"expr": "dbse_executionTime_nanos{job=\"$Server\"}/1000000",
"format": "time_series",
"intervalFactor": 1,
"legendFormat": "{{statement}}",
"refId": "A"
},
{
"expr": "dbse_resultValue{job=\"$Server\", statement!=\"1_from_dual\"}",
"format": "time_series",
"intervalFactor": 1,
"legendFormat": "{{statement}}_value",
"refId": "B"
}
],
"thresholds": [],
"timeFrom": null,
"timeShift": null,
"title": "Query Ausführungszeiten $Server",
"tooltip": {
"shared": true,
"sort": 0,
"value_type": "individual"
},
"type": "graph",
"xaxis": {
"buckets": null,
"mode": "time",
"name": null,
"show": true,
"values": []
},
"yaxes": [
{
"format": "ms",
"label": null,
"logBase": 1,
"max": null,
"min": "0",
"show": true
},
{
"format": "short",
"label": null,
"logBase": 1,
"max": null,
"min": null,
"show": true
}
]
}
],
"repeat": null,
"repeatIteration": null,
"repeatRowId": null,
"showTitle": true,
"title": "Query Ausführungszeiten",
"titleSize": "h6"
},
{
"collapse": true,
"height": 250,
"panels": [
{
"aliasColors": {},
"bars": false,
"dashLength": 10,
"dashes": false,
"datasource": null,
"description": "",
"fill": 1,
"id": 2,
"legend": {
"avg": false,
"current": false,
"max": false,
"min": false,
"show": true,
"total": false,
"values": false
},
"lines": true,
"linewidth": 1,
"links": [],
"nullPointMode": "null",
"percentage": false,
"pointradius": 5,
"points": false,
"renderer": "flot",
"repeat": "Server",
"scopedVars": {
"Server": {
"selected": false,
"text": "GRTD-PreProd",
"value": "GRTD-PreProd"
}
},
"seriesOverrides": [],
"spaceLength": 10,
"span": 4,
"stack": false,
"steppedLine": false,
"targets": [
{
"expr": "irate(node_disk_io_time_ms{job=\"$Server\"} [5m])",
"format": "time_series",
"intervalFactor": 1,
"legendFormat": "{{device}}",
"refId": "A"
}
],
"thresholds": [],
"timeFrom": null,
"timeShift": null,
"title": "Disk-IO-Time $Server",
"tooltip": {
"shared": true,
"sort": 0,
"value_type": "individual"
},
"type": "graph",
"xaxis": {
"buckets": null,
"mode": "time",
"name": null,
"show": true,
"values": []
},
"yaxes": [
{
"format": "ms",
"label": null,
"logBase": 1,
"max": null,
"min": "0",
"show": true
},
{
"format": "short",
"label": null,
"logBase": 1,
"max": null,
"min": null,
"show": false
}
]
},
{
"aliasColors": {},
"bars": false,
"dashLength": 10,
"dashes": false,
"datasource": null,
"description": "",
"fill": 1,
"id": 62,
"legend": {
"avg": false,
"current": false,
"max": false,
"min": false,
"show": true,
"total": false,
"values": false
},
"lines": true,
"linewidth": 1,
"links": [],
"nullPointMode": "null",
"percentage": false,
"pointradius": 5,
"points": false,
"renderer": "flot",
"repeat": null,
"repeatIteration": 1575468522162,
"repeatPanelId": 2,
"scopedVars": {
"Server": {
"selected": false,
"text": "GRTD-Prod",
"value": "GRTD-Prod"
}
},
"seriesOverrides": [],
"spaceLength": 10,
"span": 4,
"stack": false,
"steppedLine": false,
"targets": [
{
"expr": "irate(node_disk_io_time_ms{job=\"$Server\"} [5m])",
"format": "time_series",
"intervalFactor": 1,
"legendFormat": "{{device}}",
"refId": "A"
}
],
"thresholds": [],
"timeFrom": null,
"timeShift": null,
"title": "Disk-IO-Time $Server",
"tooltip": {
"shared": true,
"sort": 0,
"value_type": "individual"
},
"type": "graph",
"xaxis": {
"buckets": null,
"mode": "time",
"name": null,
"show": true,
"values": []
},
"yaxes": [
{
"format": "ms",
"label": null,
"logBase": 1,
"max": null,
"min": "0",
"show": true
},
{
"format": "short",
"label": null,
"logBase": 1,
"max": null,
"min": null,
"show": false
}
]
},
{
"aliasColors": {},
"bars": false,
"dashLength": 10,
"dashes": false,
"datasource": null,
"description": "",
"fill": 1,
"id": 63,
"legend": {
"avg": false,
"current": false,
"max": false,
"min": false,
"show": true,
"total": false,
"values": false
},
"lines": true,
"linewidth": 1,
"links": [],
"nullPointMode": "null",
"percentage": false,
"pointradius": 5,
"points": false,
"renderer": "flot",
"repeat": null,
"repeatIteration": 1575468522162,
"repeatPanelId": 2,
"scopedVars": {
"Server": {
"selected": false,
"text": "GRTD-Test",
"value": "GRTD-Test"
}
},
"seriesOverrides": [],
"spaceLength": 10,
"span": 4,
"stack": false,
"steppedLine": false,
"targets": [
{
"expr": "irate(node_disk_io_time_ms{job=\"$Server\"} [5m])",
"format": "time_series",
"intervalFactor": 1,
"legendFormat": "{{device}}",
"refId": "A"
}
],
"thresholds": [],
"timeFrom": null,
"timeShift": null,
"title": "Disk-IO-Time $Server",
"tooltip": {
"shared": true,
"sort": 0,
"value_type": "individual"
},
"type": "graph",
"xaxis": {
"buckets": null,
"mode": "time",
"name": null,
"show": true,
"values": []
},
"yaxes": [
{
"format": "ms",
"label": null,
"logBase": 1,
"max": null,
"min": "0",
"show": true
},
{
"format": "short",
"label": null,
"logBase": 1,
"max": null,
"min": null,
"show": false
}
]
}
],
"repeat": null,
"repeatIteration": null,
"repeatRowId": null,
"showTitle": true,
"title": "Disk-IO-Time",
"titleSize": "h6"
},
{
"collapse": true,
"height": 250,
"panels": [
{
"aliasColors": {
"Slab": "#E5A8E2",
"Swap": "#E24D42"
},
"bars": false,
"dashLength": 10,
"dashes": false,
"datasource": "lokaler Prometheus",
"decimals": 2,
"editable": true,
"error": false,
"fill": 1,
"grid": {},
"id": 18,
"legend": {
"avg": false,
"current": false,
"max": false,
"min": false,
"show": true,
"total": false,
"values": false
},
"lines": true,
"linewidth": 2,
"links": [],
"minSpan": null,
"nullPointMode": "connected",
"percentage": false,
"pointradius": 5,
"points": false,
"renderer": "flot",
"repeat": "Server",
"scopedVars": {
"Server": {
"selected": false,
"text": "GRTD-PreProd",
"value": "GRTD-PreProd"
}
},
"seriesOverrides": [
{
"alias": "/Apps|Buffers|Cached|Free|Slab|SwapCached|PageTables|VmallocUsed/",
"fill": 5,
"stack": true
},
{
"alias": "Swap",
"fill": 5,
"stack": true
}
],
"spaceLength": 10,
"span": 4,
"stack": false,
"steppedLine": false,
"targets": [
{
"expr": "( node_memory_MemTotal{job=~'$Server'} - node_memory_MemFree{job=~'$Server'} - node_memory_Buffers{job=~'$Server'} - node_memory_Cached{job=~'$Server'} - node_memory_SwapCached{job=~'$Server'} - node_memory_Slab{job=~'$Server'} - node_memory_PageTables{job=~'$Server'} - node_memory_VmallocUsed{job=~'$Server'} )",
"format": "time_series",
"interval": "",
"intervalFactor": 1,
"legendFormat": "Gesamt",
"metric": "",
"refId": "A",
"step": 1200,
"target": ""
},
{
"expr": "namedprocess_namegroup_memory_bytes{job=~'$Server'}",
"format": "time_series",
"intervalFactor": 1,
"legendFormat": "{{groupname}} {{memtype}}",
"refId": "B"
}
],
"thresholds": [],
"timeFrom": null,
"timeShift": null,
"title": "Application Memory $Server",
"tooltip": {
"msResolution": false,
"shared": true,
"sort": 0,
"value_type": "individual"
},
"type": "graph",
"xaxis": {
"buckets": null,
"mode": "time",
"name": null,
"show": true,
"values": []
},
"yaxes": [
{
"format": "bytes",
"label": "GB",
"logBase": 1,
"max": null,
"min": null,
"show": true
},
{
"format": "short",
"logBase": 1,
"max": null,
"min": null,
"show": true
}
]
},
{
"aliasColors": {
"Slab": "#E5A8E2",
"Swap": "#E24D42"
},
"bars": false,
"dashLength": 10,
"dashes": false,
"datasource": "lokaler Prometheus",
"decimals": 2,
"editable": true,
"error": false,
"fill": 1,
"grid": {},
"id": 64,
"legend": {
"avg": false,
"current": false,
"max": false,
"min": false,
"show": true,
"total": false,
"values": false
},
"lines": true,
"linewidth": 2,
"links": [],
"minSpan": null,
"nullPointMode": "connected",
"percentage": false,
"pointradius": 5,
"points": false,
"renderer": "flot",
"repeat": null,
"repeatIteration": 1575468522162,
"repeatPanelId": 18,
"scopedVars": {
"Server": {
"selected": false,
"text": "GRTD-Prod",
"value": "GRTD-Prod"
}
},
"seriesOverrides": [
{
"alias": "/Apps|Buffers|Cached|Free|Slab|SwapCached|PageTables|VmallocUsed/",
"fill": 5,
"stack": true
},
{
"alias": "Swap",
"fill": 5,
"stack": true
}
],
"spaceLength": 10,
"span": 4,
"stack": false,
"steppedLine": false,
"targets": [
{
"expr": "( node_memory_MemTotal{job=~'$Server'} - node_memory_MemFree{job=~'$Server'} - node_memory_Buffers{job=~'$Server'} - node_memory_Cached{job=~'$Server'} - node_memory_SwapCached{job=~'$Server'} - node_memory_Slab{job=~'$Server'} - node_memory_PageTables{job=~'$Server'} - node_memory_VmallocUsed{job=~'$Server'} )",
"format": "time_series",
"interval": "",
"intervalFactor": 1,
"legendFormat": "Gesamt",
"metric": "",
"refId": "A",
"step": 1200,
"target": ""
},
{
"expr": "namedprocess_namegroup_memory_bytes{job=~'$Server'}",
"format": "time_series",
"intervalFactor": 1,
"legendFormat": "{{groupname}} {{memtype}}",
"refId": "B"
}
],
"thresholds": [],
"timeFrom": null,
"timeShift": null,
"title": "Application Memory $Server",
"tooltip": {
"msResolution": false,
"shared": true,
"sort": 0,
"value_type": "individual"
},
"type": "graph",
"xaxis": {
"buckets": null,
"mode": "time",
"name": null,
"show": true,
"values": []
},
"yaxes": [
{
"format": "bytes",
"label": "GB",
"logBase": 1,
"max": null,
"min": null,
"show": true
},
{
"format": "short",
"logBase": 1,
"max": null,
"min": null,
"show": true
}
]
},
{
"aliasColors": {
"Slab": "#E5A8E2",
"Swap": "#E24D42"
},
"bars": false,
"dashLength": 10,
"dashes": false,
"datasource": "lokaler Prometheus",
"decimals": 2,
"editable": true,
"error": false,
"fill": 1,
"grid": {},
"id": 65,
"legend": {
"avg": false,
"current": false,
"max": false,
"min": false,
"show": true,
"total": false,
"values": false
},
"lines": true,
"linewidth": 2,
"links": [],
"minSpan": null,
"nullPointMode": "connected",
"percentage": false,
"pointradius": 5,
"points": false,
"renderer": "flot",
"repeat": null,
"repeatIteration": 1575468522162,
"repeatPanelId": 18,
"scopedVars": {
"Server": {
"selected": false,
"text": "GRTD-Test",
"value": "GRTD-Test"
}
},
"seriesOverrides": [
{
"alias": "/Apps|Buffers|Cached|Free|Slab|SwapCached|PageTables|VmallocUsed/",
"fill": 5,
"stack": true
},
{
"alias": "Swap",
"fill": 5,
"stack": true
}
],
"spaceLength": 10,
"span": 4,
"stack": false,
"steppedLine": false,
"targets": [
{
"expr": "( node_memory_MemTotal{job=~'$Server'} - node_memory_MemFree{job=~'$Server'} - node_memory_Buffers{job=~'$Server'} - node_memory_Cached{job=~'$Server'} - node_memory_SwapCached{job=~'$Server'} - node_memory_Slab{job=~'$Server'} - node_memory_PageTables{job=~'$Server'} - node_memory_VmallocUsed{job=~'$Server'} )",
"format": "time_series",
"interval": "",
"intervalFactor": 1,
"legendFormat": "Gesamt",
"metric": "",
"refId": "A",
"step": 1200,
"target": ""
},
{
"expr": "namedprocess_namegroup_memory_bytes{job=~'$Server'}",
"format": "time_series",
"intervalFactor": 1,
"legendFormat": "{{groupname}} {{memtype}}",
"refId": "B"
}
],
"thresholds": [],
"timeFrom": null,
"timeShift": null,
"title": "Application Memory $Server",
"tooltip": {
"msResolution": false,
"shared": true,
"sort": 0,
"value_type": "individual"
},
"type": "graph",
"xaxis": {
"buckets": null,
"mode": "time",
"name": null,
"show": true,
"values": []
},
"yaxes": [
{
"format": "bytes",
"label": "GB",
"logBase": 1,
"max": null,
"min": null,
"show": true
},
{
"format": "short",
"logBase": 1,
"max": null,
"min": null,
"show": true
}
]
}
],
"repeat": null,
"repeatIteration": null,
"repeatRowId": null,
"showTitle": true,
"title": "Application Memory",
"titleSize": "h6"
},
{
"collapse": false,
"height": 250,
"panels": [
{
"aliasColors": {},
"bars": false,
"dashLength": 10,
"dashes": false,
"datasource": null,
"decimals": 3,
"editable": true,
"error": false,
"fill": 1,
"grid": {},
"id": 36,
"legend": {
"avg": false,
"current": false,
"max": false,
"min": false,
"show": true,
"total": false,
"values": false
},
"lines": true,
"linewidth": 2,
"links": [],
"minSpan": null,
"nullPointMode": "connected",
"percentage": false,
"pointradius": 5,
"points": false,
"renderer": "flot",
"repeat": "Server",
"scopedVars": {
"Server": {
"selected": false,
"text": "GRTD-PreProd",
"value": "GRTD-PreProd"
}
},
"seriesOverrides": [],
"spaceLength": 10,
"span": 4,
"stack": false,
"steppedLine": false,
"targets": [
{
"expr": "100.0 - 100 * (node_filesystem_avail{job=~'$Server',mountpoint=~\"/.*\"} / node_filesystem_size{job=~'$Server',mountpoint=~\"/.*\"})",
"format": "time_series",
"intervalFactor": 2,
"legendFormat": "{{mountpoint}}",
"refId": "B"
}
],
"thresholds": [],
"timeFrom": null,
"timeShift": null,
"title": "Disk Space Used $Server",
"tooltip": {
"msResolution": true,
"shared": true,
"sort": 0,
"value_type": "cumulative"
},
"type": "graph",
"xaxis": {
"buckets": null,
"mode": "time",
"name": null,
"show": true,
"values": []
},
"yaxes": [
{
"format": "percent",
"logBase": 1,
"max": 100,
"min": 0,
"show": true
},
{
"format": "short",
"logBase": 1,
"max": null,
"min": null,
"show": true
}
]
},
{
"aliasColors": {},
"bars": false,
"dashLength": 10,
"dashes": false,
"datasource": null,
"decimals": 3,
"editable": true,
"error": false,
"fill": 1,
"grid": {},
"id": 66,
"legend": {
"avg": false,
"current": false,
"max": false,
"min": false,
"show": true,
"total": false,
"values": false
},
"lines": true,
"linewidth": 2,
"links": [],
"minSpan": null,
"nullPointMode": "connected",
"percentage": false,
"pointradius": 5,
"points": false,
"renderer": "flot",
"repeat": null,
"repeatIteration": 1575468522162,
"repeatPanelId": 36,
"scopedVars": {
"Server": {
"selected": false,
"text": "GRTD-Prod",
"value": "GRTD-Prod"
}
},
"seriesOverrides": [],
"spaceLength": 10,
"span": 4,
"stack": false,
"steppedLine": false,
"targets": [
{
"expr": "100.0 - 100 * (node_filesystem_avail{job=~'$Server',mountpoint=~\"/.*\"} / node_filesystem_size{job=~'$Server',mountpoint=~\"/.*\"})",
"format": "time_series",
"intervalFactor": 2,
"legendFormat": "{{mountpoint}}",
"refId": "B"
}
],
"thresholds": [],
"timeFrom": null,
"timeShift": null,
"title": "Disk Space Used $Server",
"tooltip": {
"msResolution": true,
"shared": true,
"sort": 0,
"value_type": "cumulative"
},
"type": "graph",
"xaxis": {
"buckets": null,
"mode": "time",
"name": null,
"show": true,
"values": []
},
"yaxes": [
{
"format": "percent",
"logBase": 1,
"max": 100,
"min": 0,
"show": true
},
{
"format": "short",
"logBase": 1,
"max": null,
"min": null,
"show": true
}
]
},
{
"aliasColors": {},
"bars": false,
"dashLength": 10,
"dashes": false,
"datasource": null,
"decimals": 3,
"editable": true,
"error": false,
"fill": 1,
"grid": {},
"id": 67,
"legend": {
"avg": false,
"current": false,
"max": false,
"min": false,
"show": true,
"total": false,
"values": false
},
"lines": true,
"linewidth": 2,
"links": [],
"minSpan": null,
"nullPointMode": "connected",
"percentage": false,
"pointradius": 5,
"points": false,
"renderer": "flot",
"repeat": null,
"repeatIteration": 1575468522162,
"repeatPanelId": 36,
"scopedVars": {
"Server": {
"selected": false,
"text": "GRTD-Test",
"value": "GRTD-Test"
}
},
"seriesOverrides": [],
"spaceLength": 10,
"span": 4,
"stack": false,
"steppedLine": false,
"targets": [
{
"expr": "100.0 - 100 * (node_filesystem_avail{job=~'$Server',mountpoint=~\"/.*\"} / node_filesystem_size{job=~'$Server',mountpoint=~\"/.*\"})",
"format": "time_series",
"intervalFactor": 2,
"legendFormat": "{{mountpoint}}",
"refId": "B"
}
],
"thresholds": [],
"timeFrom": null,
"timeShift": null,
"title": "Disk Space Used $Server",
"tooltip": {
"msResolution": true,
"shared": true,
"sort": 0,
"value_type": "cumulative"
},
"type": "graph",
"xaxis": {
"buckets": null,
"mode": "time",
"name": null,
"show": true,
"values": []
},
"yaxes": [
{
"format": "percent",
"logBase": 1,
"max": 100,
"min": 0,
"show": true
},
{
"format": "short",
"logBase": 1,
"max": null,
"min": null,
"show": true
}
]
}
],
"repeat": null,
"repeatIteration": null,
"repeatRowId": null,
"showTitle": false,
"title": "Dashboard Row",
"titleSize": "h6"
},
{
"collapse": false,
"height": 250,
"panels": [
{
"aliasColors": {},
"bars": false,
"dashLength": 10,
"dashes": false,
"datasource": null,
"fill": 1,
"id": 51,
"legend": {
"avg": false,
"current": false,
"max": false,
"min": false,
"show": true,
"total": false,
"values": false
},
"lines": true,
"linewidth": 1,
"links": [],
"nullPointMode": "null",
"percentage": false,
"pointradius": 5,
"points": false,
"renderer": "flot",
"repeat": "Server",
"scopedVars": {
"Server": {
"selected": false,
"text": "GRTD-PreProd",
"value": "GRTD-PreProd"
}
},
"seriesOverrides": [],
"spaceLength": 10,
"span": 4,
"stack": false,
"steppedLine": false,
"targets": [
{
"expr": "namedprocess_namegroup_num_threads{job=\"$Server\"}",
"format": "time_series",
"intervalFactor": 1,
"legendFormat": "Gesamt {{groupname}}",
"refId": "A"
},
{
"expr": "namedprocess_namegroup_states{job=\"$Server\"}",
"format": "time_series",
"intervalFactor": 1,
"legendFormat": "{{groupname}} {{state}}",
"refId": "B"
}
],
"thresholds": [],
"timeFrom": null,
"timeShift": null,
"title": "OS-Threads $Server",
"tooltip": {
"shared": true,
"sort": 0,
"value_type": "individual"
},
"type": "graph",
"xaxis": {
"buckets": null,
"mode": "time",
"name": null,
"show": true,
"values": []
},
"yaxes": [
{
"format": "short",
"label": null,
"logBase": 1,
"max": null,
"min": null,
"show": true
},
{
"format": "short",
"label": null,
"logBase": 1,
"max": null,
"min": null,
"show": true
}
]
},
{
"aliasColors": {},
"bars": false,
"dashLength": 10,
"dashes": false,
"datasource": null,
"fill": 1,
"id": 68,
"legend": {
"avg": false,
"current": false,
"max": false,
"min": false,
"show": true,
"total": false,
"values": false
},
"lines": true,
"linewidth": 1,
"links": [],
"nullPointMode": "null",
"percentage": false,
"pointradius": 5,
"points": false,
"renderer": "flot",
"repeat": null,
"repeatIteration": 1575468522162,
"repeatPanelId": 51,
"scopedVars": {
"Server": {
"selected": false,
"text": "GRTD-Prod",
"value": "GRTD-Prod"
}
},
"seriesOverrides": [],
"spaceLength": 10,
"span": 4,
"stack": false,
"steppedLine": false,
"targets": [
{
"expr": "namedprocess_namegroup_num_threads{job=\"$Server\"}",
"format": "time_series",
"intervalFactor": 1,
"legendFormat": "Gesamt {{groupname}}",
"refId": "A"
},
{
"expr": "namedprocess_namegroup_states{job=\"$Server\"}",
"format": "time_series",
"intervalFactor": 1,
"legendFormat": "{{groupname}} {{state}}",
"refId": "B"
}
],
"thresholds": [],
"timeFrom": null,
"timeShift": null,
"title": "OS-Threads $Server",
"tooltip": {
"shared": true,
"sort": 0,
"value_type": "individual"
},
"type": "graph",
"xaxis": {
"buckets": null,
"mode": "time",
"name": null,
"show": true,
"values": []
},
"yaxes": [
{
"format": "short",
"label": null,
"logBase": 1,
"max": null,
"min": null,
"show": true
},
{
"format": "short",
"label": null,
"logBase": 1,
"max": null,
"min": null,
"show": true
}
]
},
{
"aliasColors": {},
"bars": false,
"dashLength": 10,
"dashes": false,
"datasource": null,
"fill": 1,
"id": 69,
"legend": {
"avg": false,
"current": false,
"max": false,
"min": false,
"show": true,
"total": false,
"values": false
},
"lines": true,
"linewidth": 1,
"links": [],
"nullPointMode": "null",
"percentage": false,
"pointradius": 5,
"points": false,
"renderer": "flot",
"repeat": null,
"repeatIteration": 1575468522162,
"repeatPanelId": 51,
"scopedVars": {
"Server": {
"selected": false,
"text": "GRTD-Test",
"value": "GRTD-Test"
}
},
"seriesOverrides": [],
"spaceLength": 10,
"span": 4,
"stack": false,
"steppedLine": false,
"targets": [
{
"expr": "namedprocess_namegroup_num_threads{job=\"$Server\"}",
"format": "time_series",
"intervalFactor": 1,
"legendFormat": "Gesamt {{groupname}}",
"refId": "A"
},
{
"expr": "namedprocess_namegroup_states{job=\"$Server\"}",
"format": "time_series",
"intervalFactor": 1,
"legendFormat": "{{groupname}} {{state}}",
"refId": "B"
}
],
"thresholds": [],
"timeFrom": null,
"timeShift": null,
"title": "OS-Threads $Server",
"tooltip": {
"shared": true,
"sort": 0,
"value_type": "individual"
},
"type": "graph",
"xaxis": {
"buckets": null,
"mode": "time",
"name": null,
"show": true,
"values": []
},
"yaxes": [
{
"format": "short",
"label": null,
"logBase": 1,
"max": null,
"min": null,
"show": true
},
{
"format": "short",
"label": null,
"logBase": 1,
"max": null,
"min": null,
"show": true
}
]
}
],
"repeat": null,
"repeatIteration": null,
"repeatRowId": null,
"showTitle": false,
"title": "Dashboard Row",
"titleSize": "h6"
},
{
"collapse": false,
"height": 250,
"panels": [
{
"aliasColors": {},
"bars": false,
"dashLength": 10,
"dashes": false,
"datasource": null,
"fill": 1,
"id": 53,
"legend": {
"avg": false,
"current": false,
"max": false,
"min": false,
"show": true,
"total": false,
"values": false
},
"lines": true,
"linewidth": 1,
"links": [],
"nullPointMode": "null",
"percentage": false,
"pointradius": 5,
"points": false,
"renderer": "flot",
"repeat": "Server",
"scopedVars": {
"Server": {
"selected": false,
"text": "GRTD-PreProd",
"value": "GRTD-PreProd"
}
},
"seriesOverrides": [],
"spaceLength": 10,
"span": 4,
"stack": false,
"steppedLine": false,
"targets": [
{
"expr": "namedprocess_namegroup_open_filedesc{job=\"$Server\"}",
"format": "time_series",
"intervalFactor": 1,
"legendFormat": "{{groupname}}",
"refId": "A"
}
],
"thresholds": [],
"timeFrom": null,
"timeShift": null,
"title": "open FileDescriptors $Server",
"tooltip": {
"shared": true,
"sort": 0,
"value_type": "individual"
},
"type": "graph",
"xaxis": {
"buckets": null,
"mode": "time",
"name": null,
"show": true,
"values": []
},
"yaxes": [
{
"format": "short",
"label": null,
"logBase": 1,
"max": null,
"min": null,
"show": true
},
{
"format": "short",
"label": null,
"logBase": 1,
"max": null,
"min": null,
"show": true
}
]
},
{
"aliasColors": {},
"bars": false,
"dashLength": 10,
"dashes": false,
"datasource": null,
"fill": 1,
"id": 70,
"legend": {
"avg": false,
"current": false,
"max": false,
"min": false,
"show": true,
"total": false,
"values": false
},
"lines": true,
"linewidth": 1,
"links": [],
"nullPointMode": "null",
"percentage": false,
"pointradius": 5,
"points": false,
"renderer": "flot",
"repeat": null,
"repeatIteration": 1575468522162,
"repeatPanelId": 53,
"scopedVars": {
"Server": {
"selected": false,
"text": "GRTD-Prod",
"value": "GRTD-Prod"
}
},
"seriesOverrides": [],
"spaceLength": 10,
"span": 4,
"stack": false,
"steppedLine": false,
"targets": [
{
"expr": "namedprocess_namegroup_open_filedesc{job=\"$Server\"}",
"format": "time_series",
"intervalFactor": 1,
"legendFormat": "{{groupname}}",
"refId": "A"
}
],
"thresholds": [],
"timeFrom": null,
"timeShift": null,
"title": "open FileDescriptors $Server",
"tooltip": {
"shared": true,
"sort": 0,
"value_type": "individual"
},
"type": "graph",
"xaxis": {
"buckets": null,
"mode": "time",
"name": null,
"show": true,
"values": []
},
"yaxes": [
{
"format": "short",
"label": null,
"logBase": 1,
"max": null,
"min": null,
"show": true
},
{
"format": "short",
"label": null,
"logBase": 1,
"max": null,
"min": null,
"show": true
}
]
},
{
"aliasColors": {},
"bars": false,
"dashLength": 10,
"dashes": false,
"datasource": null,
"fill": 1,
"id": 71,
"legend": {
"avg": false,
"current": false,
"max": false,
"min": false,
"show": true,
"total": false,
"values": false
},
"lines": true,
"linewidth": 1,
"links": [],
"nullPointMode": "null",
"percentage": false,
"pointradius": 5,
"points": false,
"renderer": "flot",
"repeat": null,
"repeatIteration": 1575468522162,
"repeatPanelId": 53,
"scopedVars": {
"Server": {
"selected": false,
"text": "GRTD-Test",
"value": "GRTD-Test"
}
},
"seriesOverrides": [],
"spaceLength": 10,
"span": 4,
"stack": false,
"steppedLine": false,
"targets": [
{
"expr": "namedprocess_namegroup_open_filedesc{job=\"$Server\"}",
"format": "time_series",
"intervalFactor": 1,
"legendFormat": "{{groupname}}",
"refId": "A"
}
],
"thresholds": [],
"timeFrom": null,
"timeShift": null,
"title": "open FileDescriptors $Server",
"tooltip": {
"shared": true,
"sort": 0,
"value_type": "individual"
},
"type": "graph",
"xaxis": {
"buckets": null,
"mode": "time",
"name": null,
"show": true,
"values": []
},
"yaxes": [
{
"format": "short",
"label": null,
"logBase": 1,
"max": null,
"min": null,
"show": true
},
{
"format": "short",
"label": null,
"logBase": 1,
"max": null,
"min": null,
"show": true
}
]
}
],
"repeat": null,
"repeatIteration": null,
"repeatRowId": null,
"showTitle": false,
"title": "Dashboard Row",
"titleSize": "h6"
}
],
"schemaVersion": 14,
"style": "dark",
"tags": [],
"templating": {
"list": [
{
"allValue": null,
"current": {
"text": "All",
"value": "$__all"
},
"datasource": "lokaler Prometheus",
"hide": 0,
"includeAll": true,
"label": null,
"multi": true,
"name": "Server",
"options": [],
"query": "label_values(ise_resultValue, job)",
"refresh": 2,
"regex": "",
"sort": 1,
"tagValuesQuery": "",
"tags": [],
"tagsQuery": "",
"type": "query",
"useTags": false
}
]
},
"time": {
"from": "now-3d",
"to": "now"
},
"timepicker": {
"refresh_intervals": [
"5s",
"10s",
"30s",
"1m",
"5m",
"15m",
"30m",
"1h",
"2h",
"1d"
],
"time_options": [
"5m",
"15m",
"1h",
"6h",
"12h",
"24h",
"2d",
"7d",
"30d"
]
},
"timezone": "",
"title": "Virtimo Dashboard",
"version": 2
}INUBIT-Board
{
"annotations": {
"list": [
{
"builtIn": 1,
"datasource": "-- Grafana --",
"enable": true,
"hide": true,
"iconColor": "rgba(0, 211, 255, 1)",
"name": "Annotations & Alerts",
"type": "dashboard"
},
{
"datasource": "manuelle Bemerkungen",
"enable": true,
"hide": false,
"iconColor": "rgba(255, 96, 96, 1)",
"limit": 100,
"name": "manuelle Bemerkungen",
"queries": [
{
"date": "2018-04-16T11:00:00.000Z",
"text": "Migration CN-Test"
},
{
"date": "2018-04-24T08:00:00.000Z",
"text": "Migration CN-PreProd"
},
{
"date": "2018-05-09T08:00:00.000Z",
"text": "Migration CN-Prod"
}
],
"showIn": 0,
"tags": [],
"type": "tags"
}
]
},
"editable": true,
"gnetId": null,
"graphTooltip": 0,
"hideControls": false,
"id": 7,
"links": [],
"refresh": "30s",
"rows": [
{
"collapse": false,
"height": 230,
"panels": [
{
"aliasColors": {
"ERROR": "#890f02",
"PROCESSING": "#508642",
"QUEUED": "#e5ac0e",
"SUSPEND": "#6ed0e0",
"WAITING": "#d683ce",
"queuemgr_error": "#bf1b00",
"queuemgr_processing": "#508642",
"queuemgr_queued": "#e5ac0e",
"queuemgr_suspend": "#f9d9f9",
"queuemgr_waiting": "#447ebc"
},
"bars": false,
"dashLength": 10,
"dashes": false,
"datasource": null,
"fill": 1,
"id": 4,
"legend": {
"avg": false,
"current": false,
"max": false,
"min": false,
"show": true,
"total": false,
"values": false
},
"lines": true,
"linewidth": 1,
"links": [],
"nullPointMode": "null",
"percentage": false,
"pointradius": 5,
"points": false,
"renderer": "flot",
"repeat": "Server",
"scopedVars": {
"Server": {
"selected": false,
"text": "GRTD-PreProd",
"value": "GRTD-PreProd"
}
},
"seriesOverrides": [],
"spaceLength": 10,
"span": 4,
"stack": false,
"steppedLine": false,
"targets": [
{
"expr": "ise_resultValue{system=\"$Server\",metric!=\"queuemgr_total\"}",
"format": "time_series",
"intervalFactor": 1,
"legendFormat": "{{metric}}",
"refId": "A"
},
{
"expr": "dbse_resultValue{db=\"$Server\",statement=~\"queuemgr_waiting|queuemgr_processing|queuemgr_queued|queuemgr_error|queuemgr_suspend\"}",
"format": "time_series",
"intervalFactor": 1,
"legendFormat": "{{statement}}",
"refId": "B"
}
],
"thresholds": [],
"timeFrom": null,
"timeShift": null,
"title": "QueueManager Status $Server",
"tooltip": {
"shared": true,
"sort": 0,
"value_type": "individual"
},
"type": "graph",
"xaxis": {
"buckets": null,
"mode": "time",
"name": null,
"show": true,
"values": []
},
"yaxes": [
{
"decimals": 0,
"format": "short",
"label": "number of processes",
"logBase": 1,
"max": null,
"min": "0",
"show": true
},
{
"format": "short",
"label": null,
"logBase": 1,
"max": null,
"min": null,
"show": false
}
]
},
{
"aliasColors": {
"ERROR": "#890f02",
"PROCESSING": "#508642",
"QUEUED": "#e5ac0e",
"SUSPEND": "#6ed0e0",
"WAITING": "#d683ce",
"queuemgr_error": "#bf1b00",
"queuemgr_processing": "#508642",
"queuemgr_queued": "#e5ac0e",
"queuemgr_suspend": "#f9d9f9",
"queuemgr_waiting": "#447ebc"
},
"bars": false,
"dashLength": 10,
"dashes": false,
"datasource": null,
"fill": 1,
"id": 5,
"legend": {
"avg": false,
"current": false,
"max": false,
"min": false,
"show": true,
"total": false,
"values": false
},
"lines": true,
"linewidth": 1,
"links": [],
"nullPointMode": "null",
"percentage": false,
"pointradius": 5,
"points": false,
"renderer": "flot",
"repeat": null,
"repeatIteration": 1575468649767,
"repeatPanelId": 4,
"scopedVars": {
"Server": {
"selected": false,
"text": "GRTD-Prod",
"value": "GRTD-Prod"
}
},
"seriesOverrides": [],
"spaceLength": 10,
"span": 4,
"stack": false,
"steppedLine": false,
"targets": [
{
"expr": "ise_resultValue{system=\"$Server\",metric!=\"queuemgr_total\"}",
"format": "time_series",
"intervalFactor": 1,
"legendFormat": "{{metric}}",
"refId": "A"
},
{
"expr": "dbse_resultValue{db=\"$Server\",statement=~\"queuemgr_waiting|queuemgr_processing|queuemgr_queued|queuemgr_error|queuemgr_suspend\"}",
"format": "time_series",
"intervalFactor": 1,
"legendFormat": "{{statement}}",
"refId": "B"
}
],
"thresholds": [],
"timeFrom": null,
"timeShift": null,
"title": "QueueManager Status $Server",
"tooltip": {
"shared": true,
"sort": 0,
"value_type": "individual"
},
"type": "graph",
"xaxis": {
"buckets": null,
"mode": "time",
"name": null,
"show": true,
"values": []
},
"yaxes": [
{
"decimals": 0,
"format": "short",
"label": "number of processes",
"logBase": 1,
"max": null,
"min": "0",
"show": true
},
{
"format": "short",
"label": null,
"logBase": 1,
"max": null,
"min": null,
"show": false
}
]
},
{
"aliasColors": {
"ERROR": "#890f02",
"PROCESSING": "#508642",
"QUEUED": "#e5ac0e",
"SUSPEND": "#6ed0e0",
"WAITING": "#d683ce",
"queuemgr_error": "#bf1b00",
"queuemgr_processing": "#508642",
"queuemgr_queued": "#e5ac0e",
"queuemgr_suspend": "#f9d9f9",
"queuemgr_waiting": "#447ebc"
},
"bars": false,
"dashLength": 10,
"dashes": false,
"datasource": null,
"fill": 1,
"id": 6,
"legend": {
"avg": false,
"current": false,
"max": false,
"min": false,
"show": true,
"total": false,
"values": false
},
"lines": true,
"linewidth": 1,
"links": [],
"nullPointMode": "null",
"percentage": false,
"pointradius": 5,
"points": false,
"renderer": "flot",
"repeat": null,
"repeatIteration": 1575468649767,
"repeatPanelId": 4,
"scopedVars": {
"Server": {
"selected": false,
"text": "GRTD-Test",
"value": "GRTD-Test"
}
},
"seriesOverrides": [],
"spaceLength": 10,
"span": 4,
"stack": false,
"steppedLine": false,
"targets": [
{
"expr": "ise_resultValue{system=\"$Server\",metric!=\"queuemgr_total\"}",
"format": "time_series",
"intervalFactor": 1,
"legendFormat": "{{metric}}",
"refId": "A"
},
{
"expr": "dbse_resultValue{db=\"$Server\",statement=~\"queuemgr_waiting|queuemgr_processing|queuemgr_queued|queuemgr_error|queuemgr_suspend\"}",
"format": "time_series",
"intervalFactor": 1,
"legendFormat": "{{statement}}",
"refId": "B"
}
],
"thresholds": [],
"timeFrom": null,
"timeShift": null,
"title": "QueueManager Status $Server",
"tooltip": {
"shared": true,
"sort": 0,
"value_type": "individual"
},
"type": "graph",
"xaxis": {
"buckets": null,
"mode": "time",
"name": null,
"show": true,
"values": []
},
"yaxes": [
{
"decimals": 0,
"format": "short",
"label": "number of processes",
"logBase": 1,
"max": null,
"min": "0",
"show": true
},
{
"format": "short",
"label": null,
"logBase": 1,
"max": null,
"min": null,
"show": false
}
]
}
],
"repeat": null,
"repeatIteration": null,
"repeatRowId": null,
"showTitle": false,
"title": "Dashboard Row",
"titleSize": "h6"
},
{
"collapse": false,
"height": "250px",
"panels": [
{
"aliasColors": {},
"bars": false,
"dashLength": 10,
"dashes": false,
"datasource": "lokaler Prometheus",
"fill": 1,
"id": 1,
"legend": {
"avg": false,
"current": false,
"max": false,
"min": false,
"show": true,
"total": false,
"values": false
},
"lines": true,
"linewidth": 1,
"links": [],
"nullPointMode": "null",
"percentage": false,
"pointradius": 5,
"points": false,
"renderer": "flot",
"repeat": "Server",
"scopedVars": {
"Server": {
"selected": false,
"text": "GRTD-PreProd",
"value": "GRTD-PreProd"
}
},
"seriesOverrides": [],
"spaceLength": 10,
"span": 4,
"stack": false,
"steppedLine": false,
"targets": [
{
"expr": "100 - (irate(node_cpu{job=\"$Server\",mode=\"idle\"}[5m]) * 100)",
"format": "time_series",
"intervalFactor": 1,
"legendFormat": "{{cpu}}",
"refId": "A"
}
],
"thresholds": [],
"timeFrom": null,
"timeShift": null,
"title": "CPU-Auslastung $Server",
"tooltip": {
"shared": true,
"sort": 0,
"value_type": "individual"
},
"type": "graph",
"xaxis": {
"buckets": null,
"mode": "time",
"name": null,
"show": true,
"values": []
},
"yaxes": [
{
"format": "short",
"label": "%",
"logBase": 1,
"max": "100",
"min": "0",
"show": true
},
{
"format": "short",
"label": null,
"logBase": 1,
"max": null,
"min": null,
"show": true
}
]
},
{
"aliasColors": {},
"bars": false,
"dashLength": 10,
"dashes": false,
"datasource": "lokaler Prometheus",
"fill": 1,
"id": 7,
"legend": {
"avg": false,
"current": false,
"max": false,
"min": false,
"show": true,
"total": false,
"values": false
},
"lines": true,
"linewidth": 1,
"links": [],
"nullPointMode": "null",
"percentage": false,
"pointradius": 5,
"points": false,
"renderer": "flot",
"repeat": null,
"repeatIteration": 1575468649767,
"repeatPanelId": 1,
"scopedVars": {
"Server": {
"selected": false,
"text": "GRTD-Prod",
"value": "GRTD-Prod"
}
},
"seriesOverrides": [],
"spaceLength": 10,
"span": 4,
"stack": false,
"steppedLine": false,
"targets": [
{
"expr": "100 - (irate(node_cpu{job=\"$Server\",mode=\"idle\"}[5m]) * 100)",
"format": "time_series",
"intervalFactor": 1,
"legendFormat": "{{cpu}}",
"refId": "A"
}
],
"thresholds": [],
"timeFrom": null,
"timeShift": null,
"title": "CPU-Auslastung $Server",
"tooltip": {
"shared": true,
"sort": 0,
"value_type": "individual"
},
"type": "graph",
"xaxis": {
"buckets": null,
"mode": "time",
"name": null,
"show": true,
"values": []
},
"yaxes": [
{
"format": "short",
"label": "%",
"logBase": 1,
"max": "100",
"min": "0",
"show": true
},
{
"format": "short",
"label": null,
"logBase": 1,
"max": null,
"min": null,
"show": true
}
]
},
{
"aliasColors": {},
"bars": false,
"dashLength": 10,
"dashes": false,
"datasource": "lokaler Prometheus",
"fill": 1,
"id": 8,
"legend": {
"avg": false,
"current": false,
"max": false,
"min": false,
"show": true,
"total": false,
"values": false
},
"lines": true,
"linewidth": 1,
"links": [],
"nullPointMode": "null",
"percentage": false,
"pointradius": 5,
"points": false,
"renderer": "flot",
"repeat": null,
"repeatIteration": 1575468649767,
"repeatPanelId": 1,
"scopedVars": {
"Server": {
"selected": false,
"text": "GRTD-Test",
"value": "GRTD-Test"
}
},
"seriesOverrides": [],
"spaceLength": 10,
"span": 4,
"stack": false,
"steppedLine": false,
"targets": [
{
"expr": "100 - (irate(node_cpu{job=\"$Server\",mode=\"idle\"}[5m]) * 100)",
"format": "time_series",
"intervalFactor": 1,
"legendFormat": "{{cpu}}",
"refId": "A"
}
],
"thresholds": [],
"timeFrom": null,
"timeShift": null,
"title": "CPU-Auslastung $Server",
"tooltip": {
"shared": true,
"sort": 0,
"value_type": "individual"
},
"type": "graph",
"xaxis": {
"buckets": null,
"mode": "time",
"name": null,
"show": true,
"values": []
},
"yaxes": [
{
"format": "short",
"label": "%",
"logBase": 1,
"max": "100",
"min": "0",
"show": true
},
{
"format": "short",
"label": null,
"logBase": 1,
"max": null,
"min": null,
"show": true
}
]
}
],
"repeat": null,
"repeatIteration": null,
"repeatRowId": null,
"showTitle": false,
"title": "Dashboard Row",
"titleSize": "h6"
},
{
"collapse": false,
"height": 250,
"panels": [
{
"aliasColors": {},
"bars": false,
"dashLength": 10,
"dashes": false,
"datasource": null,
"fill": 1,
"id": 3,
"legend": {
"avg": false,
"current": false,
"max": false,
"min": false,
"show": true,
"total": false,
"values": false
},
"lines": true,
"linewidth": 1,
"links": [],
"nullPointMode": "null",
"percentage": false,
"pointradius": 5,
"points": false,
"renderer": "flot",
"repeat": "Server",
"scopedVars": {
"Server": {
"selected": false,
"text": "GRTD-PreProd",
"value": "GRTD-PreProd"
}
},
"seriesOverrides": [
{
"alias": "syslog_count_value",
"yaxis": 2
}
],
"spaceLength": 10,
"span": 4,
"stack": false,
"steppedLine": false,
"targets": [
{
"expr": "dbse_executionTime_nanos{job=\"$Server\", statement=~\"1_from_dual|syslog_count|writeperformance\"}/1000000",
"format": "time_series",
"intervalFactor": 1,
"legendFormat": "{{statement}}",
"refId": "A"
},
{
"expr": "dbse_resultValue{job=\"$Server\", statement=\"syslog_count\"}",
"format": "time_series",
"intervalFactor": 1,
"legendFormat": "{{statement}}_value",
"refId": "B"
}
],
"thresholds": [],
"timeFrom": null,
"timeShift": null,
"title": "Query Ausführungszeiten $Server",
"tooltip": {
"shared": true,
"sort": 0,
"value_type": "individual"
},
"type": "graph",
"xaxis": {
"buckets": null,
"mode": "time",
"name": null,
"show": true,
"values": []
},
"yaxes": [
{
"format": "ms",
"label": null,
"logBase": 1,
"max": null,
"min": "0",
"show": true
},
{
"format": "short",
"label": null,
"logBase": 1,
"max": null,
"min": null,
"show": true
}
]
},
{
"aliasColors": {},
"bars": false,
"dashLength": 10,
"dashes": false,
"datasource": null,
"fill": 1,
"id": 9,
"legend": {
"avg": false,
"current": false,
"max": false,
"min": false,
"show": true,
"total": false,
"values": false
},
"lines": true,
"linewidth": 1,
"links": [],
"nullPointMode": "null",
"percentage": false,
"pointradius": 5,
"points": false,
"renderer": "flot",
"repeat": null,
"repeatIteration": 1575468649767,
"repeatPanelId": 3,
"scopedVars": {
"Server": {
"selected": false,
"text": "GRTD-Prod",
"value": "GRTD-Prod"
}
},
"seriesOverrides": [
{
"alias": "syslog_count_value",
"yaxis": 2
}
],
"spaceLength": 10,
"span": 4,
"stack": false,
"steppedLine": false,
"targets": [
{
"expr": "dbse_executionTime_nanos{job=\"$Server\", statement=~\"1_from_dual|syslog_count|writeperformance\"}/1000000",
"format": "time_series",
"intervalFactor": 1,
"legendFormat": "{{statement}}",
"refId": "A"
},
{
"expr": "dbse_resultValue{job=\"$Server\", statement=\"syslog_count\"}",
"format": "time_series",
"intervalFactor": 1,
"legendFormat": "{{statement}}_value",
"refId": "B"
}
],
"thresholds": [],
"timeFrom": null,
"timeShift": null,
"title": "Query Ausführungszeiten $Server",
"tooltip": {
"shared": true,
"sort": 0,
"value_type": "individual"
},
"type": "graph",
"xaxis": {
"buckets": null,
"mode": "time",
"name": null,
"show": true,
"values": []
},
"yaxes": [
{
"format": "ms",
"label": null,
"logBase": 1,
"max": null,
"min": "0",
"show": true
},
{
"format": "short",
"label": null,
"logBase": 1,
"max": null,
"min": null,
"show": true
}
]
},
{
"aliasColors": {},
"bars": false,
"dashLength": 10,
"dashes": false,
"datasource": null,
"fill": 1,
"id": 10,
"legend": {
"avg": false,
"current": false,
"max": false,
"min": false,
"show": true,
"total": false,
"values": false
},
"lines": true,
"linewidth": 1,
"links": [],
"nullPointMode": "null",
"percentage": false,
"pointradius": 5,
"points": false,
"renderer": "flot",
"repeat": null,
"repeatIteration": 1575468649767,
"repeatPanelId": 3,
"scopedVars": {
"Server": {
"selected": false,
"text": "GRTD-Test",
"value": "GRTD-Test"
}
},
"seriesOverrides": [
{
"alias": "syslog_count_value",
"yaxis": 2
}
],
"spaceLength": 10,
"span": 4,
"stack": false,
"steppedLine": false,
"targets": [
{
"expr": "dbse_executionTime_nanos{job=\"$Server\", statement=~\"1_from_dual|syslog_count|writeperformance\"}/1000000",
"format": "time_series",
"intervalFactor": 1,
"legendFormat": "{{statement}}",
"refId": "A"
},
{
"expr": "dbse_resultValue{job=\"$Server\", statement=\"syslog_count\"}",
"format": "time_series",
"intervalFactor": 1,
"legendFormat": "{{statement}}_value",
"refId": "B"
}
],
"thresholds": [],
"timeFrom": null,
"timeShift": null,
"title": "Query Ausführungszeiten $Server",
"tooltip": {
"shared": true,
"sort": 0,
"value_type": "individual"
},
"type": "graph",
"xaxis": {
"buckets": null,
"mode": "time",
"name": null,
"show": true,
"values": []
},
"yaxes": [
{
"format": "ms",
"label": null,
"logBase": 1,
"max": null,
"min": "0",
"show": true
},
{
"format": "short",
"label": null,
"logBase": 1,
"max": null,
"min": null,
"show": true
}
]
}
],
"repeat": null,
"repeatIteration": null,
"repeatRowId": null,
"showTitle": false,
"title": "Dashboard Row",
"titleSize": "h6"
},
{
"collapse": false,
"height": 250,
"panels": [
{
"aliasColors": {},
"bars": false,
"dashLength": 10,
"dashes": false,
"datasource": null,
"description": "",
"fill": 1,
"id": 2,
"legend": {
"avg": false,
"current": false,
"max": false,
"min": false,
"show": true,
"total": false,
"values": false
},
"lines": true,
"linewidth": 1,
"links": [],
"nullPointMode": "null",
"percentage": false,
"pointradius": 5,
"points": false,
"renderer": "flot",
"repeat": "Server",
"scopedVars": {
"Server": {
"selected": false,
"text": "GRTD-PreProd",
"value": "GRTD-PreProd"
}
},
"seriesOverrides": [],
"spaceLength": 10,
"span": 4,
"stack": false,
"steppedLine": false,
"targets": [
{
"expr": "irate(node_disk_io_time_ms{job=\"$Server\"} [5m])",
"format": "time_series",
"intervalFactor": 1,
"legendFormat": "{{device}}",
"refId": "A"
}
],
"thresholds": [],
"timeFrom": null,
"timeShift": null,
"title": "Disk-IO-Time $Server",
"tooltip": {
"shared": true,
"sort": 0,
"value_type": "individual"
},
"type": "graph",
"xaxis": {
"buckets": null,
"mode": "time",
"name": null,
"show": true,
"values": []
},
"yaxes": [
{
"format": "ms",
"label": null,
"logBase": 1,
"max": null,
"min": "0",
"show": true
},
{
"format": "short",
"label": null,
"logBase": 1,
"max": null,
"min": null,
"show": false
}
]
},
{
"aliasColors": {},
"bars": false,
"dashLength": 10,
"dashes": false,
"datasource": null,
"description": "",
"fill": 1,
"id": 11,
"legend": {
"avg": false,
"current": false,
"max": false,
"min": false,
"show": true,
"total": false,
"values": false
},
"lines": true,
"linewidth": 1,
"links": [],
"nullPointMode": "null",
"percentage": false,
"pointradius": 5,
"points": false,
"renderer": "flot",
"repeat": null,
"repeatIteration": 1575468649767,
"repeatPanelId": 2,
"scopedVars": {
"Server": {
"selected": false,
"text": "GRTD-Prod",
"value": "GRTD-Prod"
}
},
"seriesOverrides": [],
"spaceLength": 10,
"span": 4,
"stack": false,
"steppedLine": false,
"targets": [
{
"expr": "irate(node_disk_io_time_ms{job=\"$Server\"} [5m])",
"format": "time_series",
"intervalFactor": 1,
"legendFormat": "{{device}}",
"refId": "A"
}
],
"thresholds": [],
"timeFrom": null,
"timeShift": null,
"title": "Disk-IO-Time $Server",
"tooltip": {
"shared": true,
"sort": 0,
"value_type": "individual"
},
"type": "graph",
"xaxis": {
"buckets": null,
"mode": "time",
"name": null,
"show": true,
"values": []
},
"yaxes": [
{
"format": "ms",
"label": null,
"logBase": 1,
"max": null,
"min": "0",
"show": true
},
{
"format": "short",
"label": null,
"logBase": 1,
"max": null,
"min": null,
"show": false
}
]
},
{
"aliasColors": {},
"bars": false,
"dashLength": 10,
"dashes": false,
"datasource": null,
"description": "",
"fill": 1,
"id": 12,
"legend": {
"avg": false,
"current": false,
"max": false,
"min": false,
"show": true,
"total": false,
"values": false
},
"lines": true,
"linewidth": 1,
"links": [],
"nullPointMode": "null",
"percentage": false,
"pointradius": 5,
"points": false,
"renderer": "flot",
"repeat": null,
"repeatIteration": 1575468649767,
"repeatPanelId": 2,
"scopedVars": {
"Server": {
"selected": false,
"text": "GRTD-Test",
"value": "GRTD-Test"
}
},
"seriesOverrides": [],
"spaceLength": 10,
"span": 4,
"stack": false,
"steppedLine": false,
"targets": [
{
"expr": "irate(node_disk_io_time_ms{job=\"$Server\"} [5m])",
"format": "time_series",
"intervalFactor": 1,
"legendFormat": "{{device}}",
"refId": "A"
}
],
"thresholds": [],
"timeFrom": null,
"timeShift": null,
"title": "Disk-IO-Time $Server",
"tooltip": {
"shared": true,
"sort": 0,
"value_type": "individual"
},
"type": "graph",
"xaxis": {
"buckets": null,
"mode": "time",
"name": null,
"show": true,
"values": []
},
"yaxes": [
{
"format": "ms",
"label": null,
"logBase": 1,
"max": null,
"min": "0",
"show": true
},
{
"format": "short",
"label": null,
"logBase": 1,
"max": null,
"min": null,
"show": false
}
]
}
],
"repeat": null,
"repeatIteration": null,
"repeatRowId": null,
"showTitle": false,
"title": "Dashboard Row",
"titleSize": "h6"
}
],
"schemaVersion": 14,
"style": "dark",
"tags": [],
"templating": {
"list": [
{
"allValue": null,
"current": {
"text": "All",
"value": "$__all"
},
"datasource": "lokaler Prometheus",
"hide": 0,
"includeAll": true,
"label": null,
"multi": true,
"name": "Server",
"options": [],
"query": "label_values(ise_resultValue, job)",
"refresh": 2,
"regex": "",
"sort": 1,
"tagValuesQuery": "",
"tags": [],
"tagsQuery": "",
"type": "query",
"useTags": false
}
]
},
"time": {
"from": "now/d",
"to": "now"
},
"timepicker": {
"refresh_intervals": [
"5s",
"10s",
"30s",
"1m",
"5m",
"15m",
"30m",
"1h",
"2h",
"1d"
],
"time_options": [
"5m",
"15m",
"1h",
"6h",
"12h",
"24h",
"2d",
"7d",
"30d"
]
},
"timezone": "",
"title": "Inubit Dashboard",
"version": 1
}AWS-Board
{
"annotations": {
"list": [
{
"builtIn": 1,
"datasource": "-- Grafana --",
"enable": true,
"hide": true,
"iconColor": "rgba(0, 211, 255, 1)",
"name": "Annotations & Alerts",
"type": "dashboard"
}
]
},
"editable": true,
"gnetId": null,
"graphTooltip": 0,
"hideControls": false,
"id": 5,
"links": [],
"refresh": false,
"rows": [
{
"collapse": false,
"height": 250,
"panels": [
{
"aliasColors": {},
"bars": false,
"dashLength": 10,
"dashes": false,
"datasource": null,
"fill": 1,
"id": 1,
"legend": {
"alignAsTable": true,
"avg": false,
"current": false,
"max": false,
"min": false,
"show": true,
"total": false,
"values": false
},
"lines": true,
"linewidth": 1,
"links": [],
"nullPointMode": "null",
"percentage": false,
"pointradius": 5,
"points": false,
"renderer": "flot",
"seriesOverrides": [],
"spaceLength": 10,
"span": 12,
"stack": false,
"steppedLine": false,
"targets": [
{
"expr": "aws_ec2_cpucredit_usage_average{instance_id=\"i-0999268029032295e\"}",
"format": "time_series",
"intervalFactor": 2,
"legendFormat": "Monitoring Usage",
"refId": "A"
},
{
"expr": "aws_ec2_cpucredit_balance_average{instance_id=\"i-0ed03325bd42aba11\"}",
"format": "time_series",
"intervalFactor": 2,
"legendFormat": "Gateway Balance",
"refId": "B"
},
{
"expr": "aws_ec2_cpucredit_usage_average{instance_id=\"i-0ed03325bd42aba11\"}",
"format": "time_series",
"intervalFactor": 2,
"legendFormat": "Gateway Usage",
"refId": "C"
},
{
"expr": "aws_ec2_cpucredit_balance_average{instance_id=\"i-0999268029032295e\"}",
"format": "time_series",
"intervalFactor": 2,
"legendFormat": "Monitoring Balance",
"refId": "D"
},
{
"expr": "aws_ec2_cpucredit_balance_average{instance_id!=\"i-0999268029032295e\",instance_id!=\"i-0ed03325bd42aba11\"}",
"format": "time_series",
"intervalFactor": 2,
"legendFormat": "{{instance_id}} Balance",
"refId": "E"
},
{
"expr": "aws_ec2_cpucredit_usage_average{instance_id!=\"i-0999268029032295e\",instance_id!=\"i-0ed03325bd42aba11\"}",
"format": "time_series",
"intervalFactor": 2,
"legendFormat": "{{instance_id}} Usage",
"refId": "F"
}
],
"thresholds": [],
"timeFrom": null,
"timeShift": null,
"title": "CPU-Credit Usage",
"tooltip": {
"shared": true,
"sort": 0,
"value_type": "individual"
},
"type": "graph",
"xaxis": {
"buckets": null,
"mode": "time",
"name": null,
"show": true,
"values": []
},
"yaxes": [
{
"format": "short",
"label": null,
"logBase": 1,
"max": null,
"min": null,
"show": true
},
{
"format": "short",
"label": null,
"logBase": 1,
"max": null,
"min": null,
"show": true
}
]
}
],
"repeat": null,
"repeatIteration": null,
"repeatRowId": null,
"showTitle": false,
"title": "Dashboard Row",
"titleSize": "h6"
},
{
"collapse": false,
"height": 250,
"panels": [
{
"aliasColors": {},
"bars": false,
"dashLength": 10,
"dashes": false,
"datasource": null,
"fill": 1,
"id": 2,
"legend": {
"avg": false,
"current": false,
"max": false,
"min": false,
"show": true,
"total": false,
"values": false
},
"lines": true,
"linewidth": 1,
"links": [],
"nullPointMode": "null",
"percentage": false,
"pointradius": 5,
"points": false,
"renderer": "flot",
"seriesOverrides": [],
"spaceLength": 10,
"span": 12,
"stack": false,
"steppedLine": false,
"targets": [
{
"expr": "aws_rds_free_storage_space_average",
"format": "time_series",
"hide": false,
"intervalFactor": 2,
"legendFormat": "{{dbinstance_identifier}}",
"refId": "A"
}
],
"thresholds": [],
"timeFrom": null,
"timeShift": null,
"title": "Oracle Free Storage",
"tooltip": {
"shared": true,
"sort": 0,
"value_type": "individual"
},
"type": "graph",
"xaxis": {
"buckets": null,
"mode": "time",
"name": null,
"show": true,
"values": []
},
"yaxes": [
{
"decimals": null,
"format": "decbytes",
"label": "",
"logBase": 1,
"max": null,
"min": null,
"show": true
},
{
"format": "short",
"label": null,
"logBase": 1,
"max": null,
"min": null,
"show": true
}
]
}
],
"repeat": null,
"repeatIteration": null,
"repeatRowId": null,
"showTitle": false,
"title": "Dashboard Row",
"titleSize": "h6"
},
{
"collapse": false,
"height": 250,
"panels": [
{
"aliasColors": {},
"bars": false,
"dashLength": 10,
"dashes": false,
"datasource": null,
"fill": 1,
"id": 3,
"legend": {
"avg": false,
"current": false,
"max": false,
"min": false,
"show": true,
"total": false,
"values": false
},
"lines": true,
"linewidth": 1,
"links": [],
"nullPointMode": "null",
"percentage": false,
"pointradius": 5,
"points": false,
"renderer": "flot",
"seriesOverrides": [],
"spaceLength": 10,
"span": 12,
"stack": false,
"steppedLine": false,
"targets": [
{
"expr": "aws_rds_freeable_memory_average",
"format": "time_series",
"intervalFactor": 2,
"legendFormat": "{{dbinstance_identifier}}",
"refId": "A"
}
],
"thresholds": [],
"timeFrom": null,
"timeShift": null,
"title": "Oracle Free RAM",
"tooltip": {
"shared": true,
"sort": 0,
"value_type": "individual"
},
"type": "graph",
"xaxis": {
"buckets": null,
"mode": "time",
"name": null,
"show": true,
"values": []
},
"yaxes": [
{
"format": "decbytes",
"label": "",
"logBase": 1,
"max": null,
"min": null,
"show": true
},
{
"format": "short",
"label": null,
"logBase": 1,
"max": null,
"min": null,
"show": true
}
]
}
],
"repeat": null,
"repeatIteration": null,
"repeatRowId": null,
"showTitle": false,
"title": "Dashboard Row",
"titleSize": "h6"
},
{
"collapse": false,
"height": 250,
"panels": [
{
"aliasColors": {},
"bars": false,
"dashLength": 10,
"dashes": false,
"datasource": null,
"fill": 1,
"id": 4,
"legend": {
"avg": false,
"current": false,
"max": false,
"min": false,
"show": true,
"total": false,
"values": false
},
"lines": true,
"linewidth": 1,
"links": [],
"nullPointMode": "null",
"percentage": false,
"pointradius": 5,
"points": false,
"renderer": "flot",
"seriesOverrides": [],
"spaceLength": 10,
"span": 12,
"stack": false,
"steppedLine": false,
"targets": [
{
"expr": "aws_rds_cpuutilization_average",
"format": "time_series",
"intervalFactor": 2,
"legendFormat": "{{dbinstance_identifier}}",
"refId": "A"
}
],
"thresholds": [],
"timeFrom": null,
"timeShift": null,
"title": "Oracle CPU Usage",
"tooltip": {
"shared": true,
"sort": 0,
"value_type": "individual"
},
"type": "graph",
"xaxis": {
"buckets": null,
"mode": "time",
"name": null,
"show": true,
"values": []
},
"yaxes": [
{
"format": "percent",
"label": null,
"logBase": 1,
"max": null,
"min": null,
"show": true
},
{
"format": "short",
"label": null,
"logBase": 1,
"max": null,
"min": null,
"show": true
}
]
}
],
"repeat": null,
"repeatIteration": null,
"repeatRowId": null,
"showTitle": false,
"title": "Dashboard Row",
"titleSize": "h6"
},
{
"collapse": false,
"height": 250,
"panels": [
{
"aliasColors": {},
"bars": false,
"dashLength": 10,
"dashes": false,
"datasource": null,
"fill": 1,
"id": 5,
"legend": {
"avg": false,
"current": false,
"max": false,
"min": false,
"show": true,
"total": false,
"values": false
},
"lines": true,
"linewidth": 1,
"links": [],
"nullPointMode": "null",
"percentage": false,
"pointradius": 5,
"points": false,
"renderer": "flot",
"seriesOverrides": [],
"spaceLength": 10,
"span": 12,
"stack": false,
"steppedLine": false,
"targets": [
{
"expr": "aws_rds_disk_queue_depth_average",
"format": "time_series",
"intervalFactor": 2,
"legendFormat": "{{dbinstance_identifier}}",
"refId": "A"
}
],
"thresholds": [],
"timeFrom": null,
"timeShift": null,
"title": "Oracle Disk Queue",
"tooltip": {
"shared": true,
"sort": 0,
"value_type": "individual"
},
"type": "graph",
"xaxis": {
"buckets": null,
"mode": "time",
"name": null,
"show": true,
"values": []
},
"yaxes": [
{
"format": "short",
"label": null,
"logBase": 1,
"max": null,
"min": null,
"show": true
},
{
"format": "short",
"label": null,
"logBase": 1,
"max": null,
"min": null,
"show": true
}
]
}
],
"repeat": null,
"repeatIteration": null,
"repeatRowId": null,
"showTitle": false,
"title": "Dashboard Row",
"titleSize": "h6"
}
],
"schemaVersion": 14,
"style": "dark",
"tags": [],
"templating": {
"list": []
},
"time": {
"from": "now-3h",
"to": "now"
},
"timepicker": {
"refresh_intervals": [
"5s",
"10s",
"30s",
"1m",
"5m",
"15m",
"30m",
"1h",
"2h",
"1d"
],
"time_options": [
"5m",
"15m",
"1h",
"6h",
"12h",
"24h",
"2d",
"7d",
"30d"
]
},
"timezone": "",
"title": "AWS EC2",
"version": 6
}Linux-Server-Board
{
"annotations": {
"list": [
{
"builtIn": 1,
"datasource": "-- Grafana --",
"enable": true,
"hide": true,
"iconColor": "rgba(0, 211, 255, 1)",
"name": "Annotations & Alerts",
"type": "dashboard"
}
]
},
"description": "Dashboard to view multiple servers",
"editable": true,
"gnetId": 405,
"graphTooltip": 0,
"hideControls": false,
"id": 3,
"links": [],
"refresh": "30s",
"rows": [
{
"collapse": false,
"height": "25px",
"panels": [
{
"content": "",
"editable": true,
"error": false,
"id": 11,
"minSpan": 2,
"mode": "html",
"repeat": "node",
"scopedVars": {
"node": {
"selected": true,
"text": "10.2.1.10:9100",
"value": "10.2.1.10:9100"
}
},
"span": 12,
"style": {},
"title": "$node",
"type": "text"
}
],
"repeat": null,
"repeatIteration": null,
"repeatRowId": null,
"showTitle": false,
"title": "Title",
"titleSize": "h6"
},
{
"collapse": false,
"height": "25px",
"panels": [
{
"cacheTimeout": null,
"colorBackground": false,
"colorValue": false,
"colors": [
"rgba(245, 54, 54, 0.9)",
"rgba(237, 129, 40, 0.89)",
"rgba(50, 172, 45, 0.97)"
],
"datasource": "lokaler Prometheus",
"editable": true,
"error": false,
"format": "none",
"gauge": {
"maxValue": 100,
"minValue": 0,
"show": false,
"thresholdLabels": false,
"thresholdMarkers": true
},
"id": 20,
"interval": null,
"links": [],
"mappingType": 1,
"mappingTypes": [
{
"name": "value to text",
"value": 1
},
{
"name": "range to text",
"value": 2
}
],
"maxDataPoints": 100,
"minSpan": 2,
"nullPointMode": "connected",
"nullText": null,
"postfix": "",
"postfixFontSize": "50%",
"prefix": "",
"prefixFontSize": "50%",
"rangeMaps": [
{
"from": "null",
"text": "N/A",
"to": "null"
}
],
"repeat": "node",
"scopedVars": {
"node": {
"selected": true,
"text": "10.2.1.10:9100",
"value": "10.2.1.10:9100"
}
},
"span": 12,
"sparkline": {
"fillColor": "rgba(31, 118, 189, 0.18)",
"full": false,
"lineColor": "rgb(31, 120, 193)",
"show": false
},
"tableColumn": "",
"targets": [
{
"expr": "count(node_cpu{instance=~\"$node\", mode=\"system\"})",
"format": "time_series",
"interval": "",
"intervalFactor": 2,
"legendFormat": "",
"metric": "",
"refId": "A",
"step": 14400,
"target": ""
}
],
"thresholds": "",
"title": "CPU Cores",
"type": "singlestat",
"valueFontSize": "80%",
"valueMaps": [
{
"op": "=",
"text": "N/A",
"value": "null"
}
],
"valueName": "avg"
}
],
"repeat": null,
"repeatIteration": null,
"repeatRowId": null,
"showTitle": false,
"title": "New row",
"titleSize": "h6"
},
{
"collapse": false,
"height": "250px",
"panels": [
{
"aliasColors": {},
"bars": false,
"dashLength": 10,
"dashes": false,
"datasource": "lokaler Prometheus",
"decimals": 3,
"editable": true,
"error": false,
"fill": 10,
"grid": {},
"id": 7,
"legend": {
"alignAsTable": false,
"avg": false,
"current": false,
"hideEmpty": false,
"max": false,
"min": false,
"rightSide": false,
"show": true,
"total": false,
"values": false
},
"lines": true,
"linewidth": 0,
"links": [],
"minSpan": 2,
"nullPointMode": "connected",
"percentage": true,
"pointradius": 5,
"points": false,
"renderer": "flot",
"repeat": "node",
"scopedVars": {
"node": {
"selected": true,
"text": "10.2.1.10:9100",
"value": "10.2.1.10:9100"
}
},
"seriesOverrides": [],
"spaceLength": 10,
"span": 12,
"stack": true,
"steppedLine": false,
"targets": [
{
"expr": "sum by (mode)(irate(node_cpu{mode=\"system\",instance=~'$node'}[5m]))",
"format": "time_series",
"interval": "",
"intervalFactor": 2,
"legendFormat": "{{mode}}",
"metric": "",
"refId": "A",
"step": 1200,
"target": ""
},
{
"expr": "sum by (mode)(irate(node_cpu{mode='user',instance=~'$node'}[5m]))",
"format": "time_series",
"interval": "",
"intervalFactor": 2,
"legendFormat": "user",
"refId": "B",
"step": 1200
},
{
"expr": "sum by (mode)(irate(node_cpu{mode='nice',instance=~'$node'}[5m]))",
"format": "time_series",
"interval": "",
"intervalFactor": 2,
"legendFormat": "nice",
"refId": "C",
"step": 1200
},
{
"expr": "sum by (mode)(irate(node_cpu{mode='iowait',instance=~'$node'}[5m]))",
"format": "time_series",
"interval": "",
"intervalFactor": 2,
"legendFormat": "iowait",
"refId": "E",
"step": 1200
},
{
"expr": "sum by (mode)(irate(node_cpu{mode='steal',instance=~'$node'}[5m]))",
"format": "time_series",
"intervalFactor": 2,
"legendFormat": "steal",
"refId": "H",
"step": 1200
},
{
"expr": "sum by (mode)(irate(node_cpu{mode='idle',instance=~'$node'}[5m]))",
"format": "time_series",
"interval": "",
"intervalFactor": 2,
"legendFormat": "idle",
"refId": "D",
"step": 1200
},
{
"expr": "sum by (mode)(irate(node_cpu{mode='irq',instance=~'$node'}[5m]))",
"format": "time_series",
"interval": "",
"intervalFactor": 2,
"legendFormat": "irq",
"refId": "F",
"step": 1200
},
{
"expr": "sum by (mode)(irate(node_cpu{mode='softirq',instance=~'$node'}[5m]))",
"format": "time_series",
"interval": "",
"intervalFactor": 2,
"legendFormat": "softirq",
"refId": "G",
"step": 1200
},
{
"expr": "sum by (mode)(irate(node_cpu{mode='guest',instance=~'$node'}[5m]))",
"format": "time_series",
"interval": "",
"intervalFactor": 2,
"legendFormat": "guest",
"refId": "I",
"step": 1200
}
],
"thresholds": [
{
"colorMode": "custom",
"fill": true,
"fillColor": "rgba(216, 200, 27, 0.27)",
"op": "gt",
"value": 0
}
],
"timeFrom": null,
"timeShift": null,
"title": "CPU",
"tooltip": {
"msResolution": false,
"shared": true,
"sort": 0,
"value_type": "individual"
},
"type": "graph",
"xaxis": {
"buckets": null,
"mode": "time",
"name": null,
"show": true,
"values": []
},
"yaxes": [
{
"format": "short",
"label": "%",
"logBase": 1,
"max": 100,
"min": 0,
"show": true
},
{
"format": "short",
"logBase": 1,
"max": null,
"min": null,
"show": true
}
]
}
],
"repeat": null,
"repeatIteration": null,
"repeatRowId": null,
"showTitle": false,
"title": "CPU",
"titleSize": "h6"
},
{
"collapse": false,
"height": "250px",
"panels": [
{
"aliasColors": {
"Slab": "#E5A8E2",
"Swap": "#E24D42"
},
"bars": false,
"dashLength": 10,
"dashes": false,
"datasource": "lokaler Prometheus",
"decimals": 2,
"editable": true,
"error": false,
"fill": 1,
"grid": {},
"id": 17,
"legend": {
"avg": false,
"current": false,
"max": false,
"min": false,
"show": true,
"total": false,
"values": false
},
"lines": true,
"linewidth": 2,
"links": [],
"minSpan": 2,
"nullPointMode": "connected",
"percentage": false,
"pointradius": 5,
"points": false,
"renderer": "flot",
"repeat": "node",
"scopedVars": {
"node": {
"selected": true,
"text": "10.2.1.10:9100",
"value": "10.2.1.10:9100"
}
},
"seriesOverrides": [
{
"alias": "/Apps|Buffers|Cached|Free|Slab|SwapCached|PageTables|VmallocUsed/",
"fill": 5,
"stack": true
},
{
"alias": "Swap",
"fill": 5,
"stack": true
}
],
"spaceLength": 10,
"span": 12,
"stack": false,
"steppedLine": false,
"targets": [
{
"expr": "( node_memory_MemTotal{instance=~'$node'} - node_memory_MemFree{instance=~'$node'} - node_memory_Buffers{instance=~'$node'} - node_memory_Cached{instance=~'$node'} - node_memory_SwapCached{instance=~'$node'} - node_memory_Slab{instance=~'$node'} - node_memory_PageTables{instance=~'$node'} - node_memory_VmallocUsed{instance=~'$node'} )",
"format": "time_series",
"interval": "",
"intervalFactor": 2,
"legendFormat": "Apps",
"metric": "",
"refId": "A",
"step": 1200,
"target": ""
},
{
"expr": "node_memory_Buffers{instance=~'$node'}",
"format": "time_series",
"interval": "",
"intervalFactor": 2,
"legendFormat": "Buffers",
"refId": "B",
"step": 1200
},
{
"expr": "node_memory_Cached{instance=~'$node'}",
"format": "time_series",
"interval": "",
"intervalFactor": 2,
"legendFormat": "Cached",
"refId": "D",
"step": 1200
},
{
"expr": "node_memory_MemFree{instance=~'$node'}",
"format": "time_series",
"hide": false,
"interval": "",
"intervalFactor": 2,
"legendFormat": "Free",
"refId": "E",
"step": 1200
},
{
"expr": "node_memory_Slab{instance=~'$node'}",
"format": "time_series",
"interval": "",
"intervalFactor": 2,
"legendFormat": "Slab",
"refId": "F",
"step": 1200
},
{
"expr": "node_memory_SwapCached{instance=~'$node'}",
"format": "time_series",
"interval": "",
"intervalFactor": 2,
"legendFormat": "SwapCached",
"refId": "G",
"step": 1200
},
{
"expr": "node_memory_PageTables{instance=~'$node'}",
"format": "time_series",
"interval": "",
"intervalFactor": 2,
"legendFormat": "PageTables",
"refId": "H",
"step": 1200
},
{
"expr": "node_memory_VmallocUsed{instance=~'$node'}",
"format": "time_series",
"interval": "",
"intervalFactor": 2,
"legendFormat": "VmallocUsed",
"metric": "",
"refId": "I",
"step": 1200
},
{
"expr": "(node_memory_SwapTotal{instance=~'$node'} - node_memory_SwapFree{instance=~'$node'})",
"format": "time_series",
"interval": "",
"intervalFactor": 2,
"legendFormat": "Swap",
"metric": "",
"refId": "C",
"step": 1200
},
{
"expr": "node_memory_Committed_AS{instance=~'$node'}",
"format": "time_series",
"interval": "",
"intervalFactor": 2,
"legendFormat": "Committed",
"metric": "",
"refId": "J",
"step": 1200
},
{
"expr": "node_memory_Mapped{instance=~'$node'}",
"format": "time_series",
"interval": "",
"intervalFactor": 2,
"legendFormat": "Mapped",
"refId": "K",
"step": 1200
},
{
"expr": "node_memory_Active{instance=~'$node'}",
"format": "time_series",
"interval": "",
"intervalFactor": 2,
"legendFormat": "Active",
"metric": "",
"refId": "L",
"step": 1200
},
{
"expr": "node_memory_Inactive{instance=~'$node'}",
"format": "time_series",
"interval": "",
"intervalFactor": 2,
"legendFormat": "Inactive",
"metric": "",
"refId": "M",
"step": 1200
}
],
"thresholds": [],
"timeFrom": null,
"timeShift": null,
"title": "Memory",
"tooltip": {
"msResolution": false,
"shared": true,
"sort": 0,
"value_type": "individual"
},
"type": "graph",
"xaxis": {
"buckets": null,
"mode": "time",
"name": null,
"show": true,
"values": []
},
"yaxes": [
{
"format": "bytes",
"label": "GB",
"logBase": 1,
"max": null,
"min": null,
"show": true
},
{
"format": "short",
"logBase": 1,
"max": null,
"min": null,
"show": true
}
]
}
],
"repeat": null,
"repeatIteration": null,
"repeatRowId": null,
"showTitle": false,
"title": "Memory",
"titleSize": "h6"
},
{
"collapse": false,
"height": "250px",
"panels": [
{
"aliasColors": {},
"bars": false,
"dashLength": 10,
"dashes": false,
"datasource": "lokaler Prometheus",
"editable": true,
"error": false,
"fill": 1,
"grid": {},
"id": 13,
"legend": {
"avg": false,
"current": false,
"max": false,
"min": false,
"show": true,
"total": false,
"values": false
},
"lines": true,
"linewidth": 2,
"links": [],
"minSpan": 2,
"nullPointMode": "connected",
"percentage": false,
"pointradius": 5,
"points": false,
"renderer": "flot",
"repeat": "node",
"scopedVars": {
"node": {
"selected": true,
"text": "10.2.1.10:9100",
"value": "10.2.1.10:9100"
}
},
"seriesOverrides": [],
"spaceLength": 10,
"span": 12,
"stack": false,
"steppedLine": false,
"targets": [
{
"expr": "node_load1{instance=~\"$node\"}",
"format": "time_series",
"interval": "",
"intervalFactor": 2,
"legendFormat": "load",
"metric": "",
"refId": "A",
"step": 1200,
"target": ""
}
],
"thresholds": [],
"timeFrom": null,
"timeShift": null,
"title": "Load",
"tooltip": {
"msResolution": false,
"shared": true,
"sort": 0,
"value_type": "cumulative"
},
"type": "graph",
"xaxis": {
"buckets": null,
"mode": "time",
"name": null,
"show": true,
"values": []
},
"yaxes": [
{
"format": "short",
"logBase": 1,
"max": null,
"min": null,
"show": true
},
{
"format": "short",
"logBase": 1,
"max": null,
"min": null,
"show": true
}
]
}
],
"repeat": null,
"repeatIteration": null,
"repeatRowId": null,
"showTitle": false,
"title": "Load",
"titleSize": "h6"
},
{
"collapse": false,
"height": "250px",
"panels": [
{
"aliasColors": {},
"bars": false,
"dashLength": 10,
"dashes": false,
"datasource": null,
"editable": true,
"error": false,
"fill": 1,
"grid": {},
"id": 19,
"legend": {
"avg": false,
"current": false,
"max": false,
"min": false,
"show": true,
"total": false,
"values": false
},
"lines": true,
"linewidth": 2,
"links": [],
"minSpan": 2,
"nullPointMode": "connected",
"percentage": false,
"pointradius": 5,
"points": false,
"renderer": "flot",
"repeat": "node",
"scopedVars": {
"node": {
"selected": true,
"text": "10.2.1.10:9100",
"value": "10.2.1.10:9100"
}
},
"seriesOverrides": [],
"spaceLength": 10,
"span": 12,
"stack": false,
"steppedLine": false,
"targets": [
{
"expr": "irate(node_disk_io_time_ms{instance=~\"$node\"}[5m])/10",
"format": "time_series",
"interval": "",
"intervalFactor": 2,
"legendFormat": "{{device}}",
"metric": "",
"refId": "A",
"step": 1200,
"target": ""
}
],
"thresholds": [],
"timeFrom": null,
"timeShift": null,
"title": "Disk Utilization per Device",
"tooltip": {
"msResolution": false,
"shared": false,
"sort": 0,
"value_type": "cumulative"
},
"type": "graph",
"xaxis": {
"buckets": null,
"mode": "time",
"name": null,
"show": true,
"values": []
},
"yaxes": [
{
"format": "percent",
"logBase": 1,
"max": 100,
"min": null,
"show": true
},
{
"format": "short",
"logBase": 1,
"max": null,
"min": null,
"show": true
}
]
}
],
"repeat": null,
"repeatIteration": null,
"repeatRowId": null,
"showTitle": false,
"title": "Disk Utilization",
"titleSize": "h6"
},
{
"collapse": false,
"height": "250px",
"panels": [
{
"aliasColors": {},
"bars": false,
"dashLength": 10,
"dashes": false,
"datasource": null,
"editable": true,
"error": false,
"fill": 1,
"grid": {},
"id": 12,
"legend": {
"avg": false,
"current": false,
"max": false,
"min": false,
"show": true,
"total": false,
"values": false
},
"lines": true,
"linewidth": 2,
"links": [],
"minSpan": 2,
"nullPointMode": "connected",
"percentage": false,
"pointradius": 5,
"points": false,
"renderer": "flot",
"repeat": "node",
"scopedVars": {
"node": {
"selected": true,
"text": "10.2.1.10:9100",
"value": "10.2.1.10:9100"
}
},
"seriesOverrides": [
{
"alias": "/.*_in/",
"transform": "negative-Y"
}
],
"spaceLength": 10,
"span": 12,
"stack": false,
"steppedLine": false,
"targets": [
{
"expr": "irate(node_network_receive_bytes{instance=~'$node',device!=\"lo\"}[5m])*8",
"format": "time_series",
"interval": "",
"intervalFactor": 2,
"legendFormat": "{{device}}_in",
"metric": "",
"refId": "A",
"step": 1200,
"target": ""
},
{
"expr": "irate(node_network_transmit_bytes{instance=~'$node',device!=\"lo\"}[5m])*8",
"format": "time_series",
"interval": "",
"intervalFactor": 2,
"legendFormat": "{{device}}_out",
"refId": "B",
"step": 1200
}
],
"thresholds": [],
"timeFrom": null,
"timeShift": null,
"title": "Network Traffic",
"tooltip": {
"msResolution": false,
"shared": true,
"sort": 0,
"value_type": "cumulative"
},
"type": "graph",
"xaxis": {
"buckets": null,
"mode": "time",
"name": null,
"show": true,
"values": []
},
"yaxes": [
{
"format": "bits",
"label": "bits in (-) / bits out (+)",
"logBase": 1,
"max": null,
"min": null,
"show": true
},
{
"format": "short",
"logBase": 1,
"max": null,
"min": null,
"show": true
}
]
}
],
"repeat": null,
"repeatIteration": null,
"repeatRowId": null,
"showTitle": false,
"title": "New row",
"titleSize": "h6"
},
{
"collapse": false,
"height": "250px",
"panels": [
{
"aliasColors": {},
"bars": false,
"dashLength": 10,
"dashes": false,
"datasource": null,
"decimals": 3,
"editable": true,
"error": false,
"fill": 1,
"grid": {},
"id": 9,
"legend": {
"avg": false,
"current": false,
"max": false,
"min": false,
"show": true,
"total": false,
"values": false
},
"lines": true,
"linewidth": 2,
"links": [],
"minSpan": 2,
"nullPointMode": "connected",
"percentage": false,
"pointradius": 5,
"points": false,
"renderer": "flot",
"repeat": "node",
"scopedVars": {
"node": {
"selected": true,
"text": "10.2.1.10:9100",
"value": "10.2.1.10:9100"
}
},
"seriesOverrides": [],
"spaceLength": 10,
"span": 12,
"stack": false,
"steppedLine": false,
"targets": [
{
"expr": "100.0 - 100 * (node_filesystem_avail{instance=~'$node',device !~'tmpfs',device!~'by-uuid'} / node_filesystem_size{instance=~'$node',device !~'tmpfs',device!~'by-uuid'})",
"format": "time_series",
"interval": "",
"intervalFactor": 2,
"legendFormat": "{{mountpoint}}",
"metric": "",
"refId": "A",
"step": 1200,
"target": ""
}
],
"thresholds": [],
"timeFrom": null,
"timeShift": null,
"title": "Disk Space Used",
"tooltip": {
"msResolution": true,
"shared": true,
"sort": 0,
"value_type": "cumulative"
},
"type": "graph",
"xaxis": {
"buckets": null,
"mode": "time",
"name": null,
"show": true,
"values": []
},
"yaxes": [
{
"format": "percent",
"logBase": 1,
"max": 100,
"min": 0,
"show": true
},
{
"format": "short",
"logBase": 1,
"max": null,
"min": null,
"show": true
}
]
}
],
"repeat": null,
"repeatIteration": null,
"repeatRowId": null,
"showTitle": false,
"title": "Disk Used",
"titleSize": "h6"
},
{
"collapse": false,
"height": "250px",
"panels": [
{
"aliasColors": {},
"bars": false,
"dashLength": 10,
"dashes": false,
"datasource": null,
"editable": true,
"error": false,
"fill": 1,
"grid": {},
"id": 21,
"legend": {
"avg": false,
"current": false,
"max": false,
"min": false,
"show": true,
"total": false,
"values": false
},
"lines": true,
"linewidth": 2,
"links": [],
"minSpan": 2,
"nullPointMode": "connected",
"percentage": false,
"pointradius": 5,
"points": false,
"renderer": "flot",
"repeat": "node",
"scopedVars": {
"node": {
"selected": true,
"text": "10.2.1.10:9100",
"value": "10.2.1.10:9100"
}
},
"seriesOverrides": [],
"spaceLength": 10,
"span": 12,
"stack": false,
"steppedLine": false,
"targets": [
{
"expr": "node_netstat_Tcp_CurrEstab{instance=~'$node'}",
"format": "time_series",
"intervalFactor": 2,
"legendFormat": "established",
"refId": "A",
"step": 1200,
"target": ""
}
],
"thresholds": [],
"timeFrom": null,
"timeShift": null,
"title": "Netstat",
"tooltip": {
"msResolution": false,
"shared": true,
"sort": 0,
"value_type": "cumulative"
},
"type": "graph",
"xaxis": {
"buckets": null,
"mode": "time",
"name": null,
"show": true,
"values": []
},
"yaxes": [
{
"format": "short",
"logBase": 1,
"max": null,
"min": null,
"show": true
},
{
"format": "short",
"logBase": 1,
"max": null,
"min": null,
"show": true
}
]
}
],
"repeat": null,
"repeatIteration": null,
"repeatRowId": null,
"showTitle": false,
"title": "New row",
"titleSize": "h6"
},
{
"collapse": false,
"height": "250px",
"panels": [
{
"aliasColors": {},
"bars": false,
"dashLength": 10,
"dashes": false,
"datasource": null,
"editable": true,
"error": false,
"fill": 1,
"grid": {},
"id": 14,
"legend": {
"avg": false,
"current": false,
"max": false,
"min": false,
"show": true,
"total": false,
"values": false
},
"lines": true,
"linewidth": 2,
"links": [],
"minSpan": 2,
"nullPointMode": "connected",
"percentage": false,
"pointradius": 5,
"points": false,
"renderer": "flot",
"repeat": "node",
"scopedVars": {
"node": {
"selected": true,
"text": "10.2.1.10:9100",
"value": "10.2.1.10:9100"
}
},
"seriesOverrides": [
{
"alias": "/.*_read$/",
"transform": "negative-Y"
}
],
"spaceLength": 10,
"span": 12,
"stack": false,
"steppedLine": false,
"targets": [
{
"expr": "irate(node_disk_reads_completed{instance=~'$node'}[5m])",
"format": "time_series",
"interval": "",
"intervalFactor": 4,
"legendFormat": "{{device}}_read",
"metric": "",
"refId": "A",
"step": 2400,
"target": ""
},
{
"expr": "irate(node_disk_writes_completed{instance=~'$node'}[5m])",
"format": "time_series",
"intervalFactor": 2,
"legendFormat": "{{device}}_write",
"metric": "",
"refId": "B",
"step": 1200
}
],
"thresholds": [],
"timeFrom": null,
"timeShift": null,
"title": "Disk IOs per Device",
"tooltip": {
"msResolution": false,
"shared": false,
"sort": 0,
"value_type": "cumulative"
},
"type": "graph",
"xaxis": {
"buckets": null,
"mode": "time",
"name": null,
"show": true,
"values": []
},
"yaxes": [
{
"format": "short",
"label": "IO/second read (-) / write (+)",
"logBase": 1,
"max": null,
"min": null,
"show": true
},
{
"format": "short",
"logBase": 1,
"max": null,
"min": null,
"show": true
}
]
}
],
"repeat": null,
"repeatIteration": null,
"repeatRowId": null,
"showTitle": false,
"title": "Disk IOs per device",
"titleSize": "h6"
},
{
"collapse": false,
"height": "250px",
"panels": [
{
"aliasColors": {},
"bars": false,
"dashLength": 10,
"dashes": false,
"datasource": null,
"editable": true,
"error": false,
"fill": 1,
"grid": {},
"id": 18,
"legend": {
"avg": false,
"current": false,
"max": false,
"min": false,
"show": true,
"total": false,
"values": false
},
"lines": true,
"linewidth": 2,
"links": [],
"minSpan": 2,
"nullPointMode": "connected",
"percentage": false,
"pointradius": 5,
"points": false,
"renderer": "flot",
"repeat": "node",
"scopedVars": {
"node": {
"selected": true,
"text": "10.2.1.10:9100",
"value": "10.2.1.10:9100"
}
},
"seriesOverrides": [
{
"alias": "/.*_read/",
"transform": "negative-Y"
}
],
"spaceLength": 10,
"span": 12,
"stack": false,
"steppedLine": false,
"targets": [
{
"expr": "irate(node_disk_sectors_read{instance=~'$node'}[5m]) * 512",
"format": "time_series",
"interval": "",
"intervalFactor": 4,
"legendFormat": "{{device}}_read",
"refId": "B",
"step": 2400
},
{
"expr": "irate(node_disk_sectors_written{instance=~'$node'}[5m]) * 512",
"format": "time_series",
"interval": "",
"intervalFactor": 4,
"legendFormat": "{{device}}_write",
"metric": "",
"refId": "A",
"step": 2400,
"target": ""
}
],
"thresholds": [],
"timeFrom": null,
"timeShift": null,
"title": "Disk Throughput per Device",
"tooltip": {
"msResolution": false,
"shared": false,
"sort": 0,
"value_type": "cumulative"
},
"type": "graph",
"xaxis": {
"buckets": null,
"mode": "time",
"name": null,
"show": true,
"values": []
},
"yaxes": [
{
"format": "bytes",
"label": "Bytes/second read (-) / write (+)",
"logBase": 1,
"max": null,
"min": null,
"show": true
},
{
"format": "short",
"logBase": 1,
"max": null,
"min": null,
"show": true
}
]
}
],
"repeat": null,
"repeatIteration": null,
"repeatRowId": null,
"showTitle": false,
"title": "Disk Throughput per device",
"titleSize": "h6"
},
{
"collapse": false,
"height": "250px",
"panels": [
{
"aliasColors": {},
"bars": false,
"dashLength": 10,
"dashes": false,
"datasource": null,
"editable": true,
"error": false,
"fill": 1,
"grid": {},
"id": 22,
"legend": {
"avg": false,
"current": false,
"max": false,
"min": false,
"show": true,
"total": false,
"values": false
},
"lines": true,
"linewidth": 2,
"links": [],
"minSpan": 2,
"nullPointMode": "connected",
"percentage": false,
"pointradius": 5,
"points": false,
"renderer": "flot",
"repeat": "node",
"scopedVars": {
"node": {
"selected": true,
"text": "10.2.1.10:9100",
"value": "10.2.1.10:9100"
}
},
"seriesOverrides": [],
"spaceLength": 10,
"span": 12,
"stack": false,
"steppedLine": false,
"targets": [
{
"expr": "irate(node_context_switches{instance=~\"$node\"}[5m])",
"format": "time_series",
"interval": "",
"intervalFactor": 2,
"legendFormat": "context switches",
"metric": "",
"refId": "A",
"step": 1200,
"target": ""
}
],
"thresholds": [],
"timeFrom": null,
"timeShift": null,
"title": "Context Switches",
"tooltip": {
"msResolution": false,
"shared": true,
"sort": 0,
"value_type": "cumulative"
},
"type": "graph",
"xaxis": {
"buckets": null,
"mode": "time",
"name": null,
"show": true,
"values": []
},
"yaxes": [
{
"format": "short",
"logBase": 1,
"max": null,
"min": null,
"show": true
},
{
"format": "short",
"logBase": 1,
"max": null,
"min": null,
"show": true
}
]
}
],
"repeat": null,
"repeatIteration": null,
"repeatRowId": null,
"showTitle": false,
"title": "Network Traffic",
"titleSize": "h6"
},
{
"collapse": false,
"height": "250px",
"panels": [
{
"aliasColors": {},
"bars": false,
"dashLength": 10,
"dashes": false,
"datasource": "lokaler Prometheus",
"editable": true,
"error": false,
"fill": 1,
"grid": {},
"id": 23,
"legend": {
"avg": false,
"current": false,
"max": false,
"min": false,
"show": true,
"total": false,
"values": false
},
"lines": true,
"linewidth": 2,
"links": [],
"minSpan": 2,
"nullPointMode": "connected",
"percentage": false,
"pointradius": 5,
"points": false,
"renderer": "flot",
"repeat": "node",
"scopedVars": {
"node": {
"selected": true,
"text": "10.2.1.10:9100",
"value": "10.2.1.10:9100"
}
},
"seriesOverrides": [
{
"alias": "/.*Out.*/",
"transform": "negative-Y"
},
{
"alias": "Udp_NoPorts",
"yaxis": 2
}
],
"spaceLength": 10,
"span": 12,
"stack": false,
"steppedLine": false,
"targets": [
{
"expr": "irate(node_netstat_Udp_InDatagrams{instance=~\"$node\"}[5m])",
"format": "time_series",
"intervalFactor": 2,
"legendFormat": "Udp_InDatagrams",
"refId": "A",
"step": 1200,
"target": ""
},
{
"expr": "irate(node_netstat_Udp_InErrors{instance=~\"$node\"}[5m])",
"format": "time_series",
"intervalFactor": 2,
"legendFormat": "Udp_InErrors",
"refId": "B",
"step": 1200
},
{
"expr": "irate(node_netstat_Udp_OutDatagrams{instance=~\"$node\"}[5m])",
"format": "time_series",
"interval": "",
"intervalFactor": 2,
"legendFormat": "Udp_OutDatagrams",
"refId": "C",
"step": 1200
},
{
"expr": "irate(node_netstat_Udp_NoPorts{instance=~\"$node\"}[5m])",
"format": "time_series",
"intervalFactor": 2,
"legendFormat": "Udp_NoPorts",
"refId": "D",
"step": 1200
}
],
"thresholds": [],
"timeFrom": null,
"timeShift": null,
"title": "UDP Stats",
"tooltip": {
"msResolution": false,
"shared": true,
"sort": 0,
"value_type": "cumulative"
},
"type": "graph",
"xaxis": {
"buckets": null,
"mode": "time",
"name": null,
"show": true,
"values": []
},
"yaxes": [
{
"format": "short",
"logBase": 1,
"max": null,
"min": null,
"show": true
},
{
"format": "short",
"logBase": 1,
"max": null,
"min": null,
"show": true
}
]
}
],
"repeat": null,
"repeatIteration": null,
"repeatRowId": null,
"showTitle": false,
"title": "New row",
"titleSize": "h6"
}
],
"schemaVersion": 14,
"style": "dark",
"tags": [],
"templating": {
"list": [
{
"allFormat": "glob",
"allValue": null,
"current": {
"selected": false,
"text": "10.2.1.10:9100",
"value": "10.2.1.10:9100"
},
"datasource": "lokaler Prometheus",
"hide": 0,
"includeAll": false,
"label": "",
"multi": true,
"multiFormat": "regex values",
"name": "node",
"options": [],
"query": "label_values(node_boot_time, instance)",
"refresh": 2,
"regex": "",
"sort": 1,
"tagValuesQuery": "",
"tags": [],
"tagsQuery": "",
"type": "query",
"useTags": false
}
]
},
"time": {
"from": "now-3h",
"to": "now"
},
"timepicker": {
"now": true,
"refresh_intervals": [
"5s",
"10s",
"30s",
"1m",
"5m",
"15m",
"30m",
"1h",
"2h",
"1d"
],
"time_options": [
"5m",
"15m",
"1h",
"6h",
"12h",
"24h",
"2d",
"7d",
"30d"
]
},
"timezone": "browser",
"title": "Server Dashboard",
"version": 5
}Windows-Server-Board
{
"annotations": {
"list": [
{
"builtIn": 1,
"datasource": "-- Grafana --",
"enable": true,
"hide": true,
"iconColor": "rgba(0, 211, 255, 1)",
"name": "Annotations & Alerts",
"type": "dashboard"
}
]
},
"description": "General stats dashboard with node selector, uses metrics from wmi_exporter",
"editable": true,
"gnetId": 2129,
"graphTooltip": 1,
"hideControls": false,
"id": 2,
"links": [],
"refresh": "10s",
"rows": [
{
"collapse": false,
"height": 14,
"panels": [
{
"content": "",
"id": 16,
"links": [],
"mode": "html",
"repeat": "server",
"scopedVars": {
"server": {
"selected": true,
"text": "seinu1003:9182",
"value": "seinu1003:9182"
}
},
"span": 12,
"title": "$server",
"type": "text"
}
],
"repeat": null,
"repeatIteration": null,
"repeatRowId": null,
"showTitle": false,
"title": "Dashboard Row",
"titleSize": "h6"
},
{
"collapse": false,
"height": 530,
"panels": [
{
"aliasColors": {
"idle": "#0A50A1"
},
"bars": false,
"dashLength": 10,
"dashes": false,
"datasource": "Kram",
"decimals": 3,
"fill": 10,
"hideTimeOverride": false,
"id": 4,
"legend": {
"alignAsTable": true,
"avg": false,
"current": true,
"max": true,
"min": false,
"rightSide": false,
"show": true,
"total": false,
"values": true
},
"lines": true,
"linewidth": 0,
"links": [],
"nullPointMode": "null as zero",
"percentage": true,
"pointradius": 5,
"points": false,
"renderer": "flot",
"repeat": "server",
"scopedVars": {
"server": {
"selected": true,
"text": "seinu1003:9182",
"value": "seinu1003:9182"
}
},
"seriesOverrides": [],
"spaceLength": 10,
"span": 12,
"stack": true,
"steppedLine": false,
"targets": [
{
"application": {
"filter": ""
},
"expr": "sum by (mode) (rate(wmi_cpu_time_total{instance=~\"$server\"}[2m]))",
"format": "time_series",
"functions": [],
"group": {
"filter": ""
},
"hide": false,
"host": {
"filter": ""
},
"intervalFactor": 1,
"item": {
"filter": ""
},
"legendFormat": "{{mode}}",
"metric": "mysql_global_status_questions",
"mode": 0,
"options": {
"showDisabledItems": false
},
"refId": "A",
"step": 20
}
],
"thresholds": [],
"timeFrom": null,
"timeShift": null,
"title": "CPU load",
"tooltip": {
"shared": false,
"sort": 0,
"value_type": "individual"
},
"type": "graph",
"xaxis": {
"buckets": null,
"mode": "time",
"name": null,
"show": true,
"values": []
},
"yaxes": [
{
"format": "short",
"label": "%",
"logBase": 1,
"max": null,
"min": null,
"show": true
},
{
"format": "short",
"label": null,
"logBase": 1,
"max": null,
"min": null,
"show": true
}
]
}
],
"repeat": null,
"repeatIteration": null,
"repeatRowId": null,
"showTitle": false,
"title": "Dashboard Row",
"titleSize": "h6"
},
{
"collapse": false,
"height": 385,
"panels": [
{
"aliasColors": {},
"bars": false,
"dashLength": 10,
"dashes": false,
"datasource": "Kram",
"fill": 1,
"hideTimeOverride": false,
"id": 12,
"legend": {
"alignAsTable": true,
"avg": false,
"current": true,
"max": true,
"min": false,
"rightSide": false,
"show": true,
"total": false,
"values": true
},
"lines": true,
"linewidth": 1,
"links": [],
"nullPointMode": "null as zero",
"percentage": false,
"pointradius": 5,
"points": false,
"renderer": "flot",
"repeat": "server",
"scopedVars": {
"server": {
"selected": true,
"text": "seinu1003:9182",
"value": "seinu1003:9182"
}
},
"seriesOverrides": [],
"spaceLength": 10,
"span": 12,
"stack": false,
"steppedLine": false,
"targets": [
{
"application": {
"filter": ""
},
"expr": "wmi_system_threads{instance=~\"$server\"}",
"format": "time_series",
"functions": [],
"group": {
"filter": ""
},
"hide": false,
"host": {
"filter": ""
},
"intervalFactor": 1,
"item": {
"filter": ""
},
"legendFormat": "system_threads",
"metric": "mysql_global_status_questions",
"mode": 0,
"options": {
"showDisabledItems": false
},
"refId": "A",
"step": 20
}
],
"thresholds": [],
"timeFrom": null,
"timeShift": null,
"title": "system_threads",
"tooltip": {
"shared": false,
"sort": 0,
"value_type": "individual"
},
"type": "graph",
"xaxis": {
"buckets": null,
"mode": "time",
"name": null,
"show": true,
"values": []
},
"yaxes": [
{
"format": "short",
"label": null,
"logBase": 1,
"max": null,
"min": null,
"show": true
},
{
"format": "short",
"label": null,
"logBase": 1,
"max": null,
"min": null,
"show": true
}
]
}
],
"repeat": null,
"repeatIteration": null,
"repeatRowId": null,
"showTitle": false,
"title": "Dashboard Row",
"titleSize": "h6"
},
{
"collapse": false,
"height": 375,
"panels": [
{
"aliasColors": {},
"bars": false,
"dashLength": 10,
"dashes": false,
"datasource": "Kram",
"fill": 1,
"hideTimeOverride": false,
"id": 13,
"legend": {
"alignAsTable": true,
"avg": false,
"current": true,
"max": true,
"min": false,
"rightSide": false,
"show": true,
"total": false,
"values": true
},
"lines": true,
"linewidth": 1,
"links": [],
"nullPointMode": "null as zero",
"percentage": false,
"pointradius": 5,
"points": false,
"renderer": "flot",
"repeat": "server",
"scopedVars": {
"server": {
"selected": true,
"text": "seinu1003:9182",
"value": "seinu1003:9182"
}
},
"seriesOverrides": [],
"spaceLength": 10,
"span": 12,
"stack": false,
"steppedLine": false,
"targets": [
{
"application": {
"filter": ""
},
"expr": "rate(wmi_system_exception_dispatches_total{instance=~\"$server\"}[$interval])",
"format": "time_series",
"functions": [],
"group": {
"filter": ""
},
"hide": false,
"host": {
"filter": ""
},
"intervalFactor": 1,
"item": {
"filter": ""
},
"legendFormat": "exceptions",
"metric": "mysql_global_status_questions",
"mode": 0,
"options": {
"showDisabledItems": false
},
"refId": "A",
"step": 20
}
],
"thresholds": [],
"timeFrom": null,
"timeShift": null,
"title": "System exception dispatches",
"tooltip": {
"shared": false,
"sort": 0,
"value_type": "individual"
},
"type": "graph",
"xaxis": {
"buckets": null,
"mode": "time",
"name": null,
"show": true,
"values": []
},
"yaxes": [
{
"format": "short",
"label": null,
"logBase": 1,
"max": null,
"min": null,
"show": true
},
{
"format": "short",
"label": null,
"logBase": 1,
"max": null,
"min": null,
"show": true
}
]
}
],
"repeat": null,
"repeatIteration": null,
"repeatRowId": null,
"showTitle": false,
"title": "Dashboard Row",
"titleSize": "h6"
},
{
"collapse": false,
"height": 455,
"panels": [
{
"aliasColors": {},
"bars": false,
"dashLength": 10,
"dashes": false,
"datasource": "Kram",
"fill": 1,
"hideTimeOverride": false,
"id": 14,
"legend": {
"alignAsTable": true,
"avg": false,
"current": true,
"max": true,
"min": false,
"rightSide": false,
"show": true,
"total": false,
"values": true
},
"lines": true,
"linewidth": 1,
"links": [],
"nullPointMode": "null as zero",
"percentage": false,
"pointradius": 5,
"points": false,
"renderer": "flot",
"repeat": "server",
"scopedVars": {
"server": {
"selected": true,
"text": "seinu1003:9182",
"value": "seinu1003:9182"
}
},
"seriesOverrides": [],
"spaceLength": 10,
"span": 12,
"stack": false,
"steppedLine": false,
"targets": [
{
"application": {
"filter": ""
},
"expr": "wmi_os_virtual_memory_bytes{instance=~\"$server\"}",
"format": "time_series",
"functions": [],
"group": {
"filter": ""
},
"hide": false,
"host": {
"filter": ""
},
"intervalFactor": 1,
"item": {
"filter": ""
},
"legendFormat": "Virtual memory",
"metric": "mysql_global_status_questions",
"mode": 0,
"options": {
"showDisabledItems": false
},
"refId": "A",
"step": 5
},
{
"application": {
"filter": ""
},
"expr": "wmi_cs_physical_memory_bytes{instance=~\"$server\"}",
"format": "time_series",
"functions": [],
"group": {
"filter": ""
},
"hide": false,
"host": {
"filter": ""
},
"intervalFactor": 1,
"item": {
"filter": ""
},
"legendFormat": "Physical memory",
"metric": "mysql_global_status_questions",
"mode": 0,
"options": {
"showDisabledItems": false
},
"refId": "B",
"step": 5
},
{
"application": {
"filter": ""
},
"expr": "wmi_os_physical_memory_free_bytes{instance=~\"$server\"}",
"format": "time_series",
"functions": [],
"group": {
"filter": ""
},
"hide": false,
"host": {
"filter": ""
},
"intervalFactor": 1,
"item": {
"filter": ""
},
"legendFormat": "Free physical memory",
"metric": "mysql_global_status_questions",
"mode": 0,
"options": {
"showDisabledItems": false
},
"refId": "C",
"step": 5
}
],
"thresholds": [],
"timeFrom": null,
"timeShift": null,
"title": "Memory",
"tooltip": {
"shared": false,
"sort": 0,
"value_type": "individual"
},
"type": "graph",
"xaxis": {
"buckets": null,
"mode": "time",
"name": null,
"show": true,
"values": []
},
"yaxes": [
{
"format": "decbytes",
"label": null,
"logBase": 1,
"max": null,
"min": null,
"show": true
},
{
"format": "short",
"label": null,
"logBase": 1,
"max": null,
"min": null,
"show": true
}
]
}
],
"repeat": null,
"repeatIteration": null,
"repeatRowId": null,
"showTitle": false,
"title": "Dashboard Row",
"titleSize": "h6"
},
{
"collapse": false,
"height": 392,
"panels": [
{
"aliasColors": {},
"bars": false,
"dashLength": 10,
"dashes": false,
"datasource": "Kram",
"fill": 1,
"hideTimeOverride": false,
"id": 15,
"legend": {
"alignAsTable": true,
"avg": false,
"current": true,
"max": true,
"min": false,
"rightSide": false,
"show": true,
"total": false,
"values": true
},
"lines": true,
"linewidth": 1,
"links": [],
"nullPointMode": "null as zero",
"percentage": false,
"pointradius": 5,
"points": false,
"renderer": "flot",
"repeat": "server",
"scopedVars": {
"server": {
"selected": true,
"text": "seinu1003:9182",
"value": "seinu1003:9182"
}
},
"seriesOverrides": [],
"spaceLength": 10,
"span": 12,
"stack": false,
"steppedLine": false,
"targets": [
{
"application": {
"filter": ""
},
"expr": "wmi_logical_disk_free_bytes{instance=~\"$server\", volume !~\"HarddiskVolume.+\"}",
"format": "time_series",
"functions": [],
"group": {
"filter": ""
},
"hide": false,
"host": {
"filter": ""
},
"intervalFactor": 1,
"item": {
"filter": ""
},
"legendFormat": "free {{volume}}",
"metric": "mysql_global_status_questions",
"mode": 0,
"options": {
"showDisabledItems": false
},
"refId": "A",
"step": 20
}
],
"thresholds": [],
"timeFrom": null,
"timeShift": null,
"title": "Hard disk free space",
"tooltip": {
"shared": false,
"sort": 0,
"value_type": "individual"
},
"type": "graph",
"xaxis": {
"buckets": null,
"mode": "time",
"name": null,
"show": true,
"values": []
},
"yaxes": [
{
"format": "decbytes",
"label": null,
"logBase": 1,
"max": null,
"min": "0",
"show": true
},
{
"format": "short",
"label": null,
"logBase": 1,
"max": null,
"min": null,
"show": true
}
]
}
],
"repeat": null,
"repeatIteration": null,
"repeatRowId": null,
"showTitle": false,
"title": "Dashboard Row",
"titleSize": "h6"
},
{
"collapse": false,
"height": 427,
"panels": [
{
"aliasColors": {},
"bars": false,
"dashLength": 10,
"dashes": false,
"datasource": "Kram",
"fill": 2,
"hideTimeOverride": false,
"id": 8,
"legend": {
"alignAsTable": true,
"avg": false,
"current": true,
"max": true,
"min": false,
"rightSide": false,
"show": true,
"total": false,
"values": true
},
"lines": true,
"linewidth": 1,
"links": [],
"nullPointMode": "null as zero",
"percentage": false,
"pointradius": 5,
"points": false,
"renderer": "flot",
"repeat": "server",
"scopedVars": {
"server": {
"selected": true,
"text": "seinu1003:9182",
"value": "seinu1003:9182"
}
},
"seriesOverrides": [],
"spaceLength": 10,
"span": 12,
"stack": false,
"steppedLine": false,
"targets": [
{
"application": {
"filter": ""
},
"expr": "irate(wmi_logical_disk_write_bytes_total{instance=~\"$server\", volume !~\"HarddiskVolume.+\"}[$interval])",
"format": "time_series",
"functions": [],
"group": {
"filter": ""
},
"hide": false,
"host": {
"filter": ""
},
"intervalFactor": 1,
"item": {
"filter": ""
},
"legendFormat": "Write {{volume}}",
"metric": "mysql_global_status_questions",
"mode": 0,
"options": {
"showDisabledItems": false
},
"refId": "A",
"step": 20
},
{
"application": {
"filter": ""
},
"expr": "irate(wmi_logical_disk_read_bytes_total{instance=~\"$server\", volume !~\"HarddiskVolume.+\"}[$interval])",
"format": "time_series",
"functions": [],
"group": {
"filter": ""
},
"hide": false,
"host": {
"filter": ""
},
"intervalFactor": 1,
"item": {
"filter": ""
},
"legendFormat": "Read {{volume}}",
"metric": "mysql_global_status_questions",
"mode": 0,
"options": {
"showDisabledItems": false
},
"refId": "B",
"step": 20
}
],
"thresholds": [],
"timeFrom": null,
"timeShift": null,
"title": "Hard drive load",
"tooltip": {
"shared": false,
"sort": 0,
"value_type": "individual"
},
"type": "graph",
"xaxis": {
"buckets": null,
"mode": "time",
"name": null,
"show": true,
"values": []
},
"yaxes": [
{
"format": "decbytes",
"label": null,
"logBase": 1,
"max": null,
"min": null,
"show": true
},
{
"format": "short",
"label": null,
"logBase": 1,
"max": null,
"min": null,
"show": true
}
]
}
],
"repeat": null,
"repeatIteration": null,
"repeatRowId": null,
"showTitle": false,
"title": "Dashboard Row",
"titleSize": "h6"
},
{
"collapse": false,
"height": 426,
"panels": [
{
"aliasColors": {},
"bars": false,
"dashLength": 10,
"dashes": false,
"datasource": "Kram",
"fill": 1,
"hideTimeOverride": false,
"id": 9,
"legend": {
"alignAsTable": true,
"avg": false,
"current": true,
"max": true,
"min": false,
"rightSide": false,
"show": true,
"total": false,
"values": true
},
"lines": true,
"linewidth": 1,
"links": [],
"nullPointMode": "null as zero",
"percentage": false,
"pointradius": 5,
"points": false,
"renderer": "flot",
"repeat": "server",
"scopedVars": {
"server": {
"selected": true,
"text": "seinu1003:9182",
"value": "seinu1003:9182"
}
},
"seriesOverrides": [],
"spaceLength": 10,
"span": 12,
"stack": false,
"steppedLine": false,
"targets": [
{
"application": {
"filter": ""
},
"expr": "rate(wmi_logical_disk_split_ios_total{instance=~\"$server\", volume !~\"HarddiskVolume.+\"}[30s])",
"format": "time_series",
"functions": [],
"group": {
"filter": ""
},
"hide": false,
"host": {
"filter": ""
},
"intervalFactor": 1,
"item": {
"filter": ""
},
"legendFormat": "i/o {{volume}}",
"metric": "mysql_global_status_questions",
"mode": 0,
"options": {
"showDisabledItems": false
},
"refId": "A",
"step": 20
}
],
"thresholds": [],
"timeFrom": null,
"timeShift": null,
"title": "Hard disk i/o ops total",
"tooltip": {
"shared": false,
"sort": 0,
"value_type": "individual"
},
"type": "graph",
"xaxis": {
"buckets": null,
"mode": "time",
"name": null,
"show": true,
"values": []
},
"yaxes": [
{
"format": "short",
"label": null,
"logBase": 1,
"max": null,
"min": null,
"show": true
},
{
"format": "short",
"label": null,
"logBase": 1,
"max": null,
"min": null,
"show": true
}
]
}
],
"repeat": null,
"repeatIteration": null,
"repeatRowId": null,
"showTitle": false,
"title": "Dashboard Row",
"titleSize": "h6"
},
{
"collapse": false,
"height": 378,
"panels": [
{
"aliasColors": {},
"bars": false,
"dashLength": 10,
"dashes": false,
"datasource": "Kram",
"decimals": null,
"fill": 1,
"hideTimeOverride": false,
"id": 11,
"legend": {
"alignAsTable": true,
"avg": false,
"current": true,
"max": true,
"min": false,
"rightSide": false,
"show": true,
"total": false,
"values": true
},
"lines": true,
"linewidth": 1,
"links": [],
"nullPointMode": "null as zero",
"percentage": false,
"pointradius": 5,
"points": false,
"renderer": "flot",
"repeat": "server",
"scopedVars": {
"server": {
"selected": true,
"text": "seinu1003:9182",
"value": "seinu1003:9182"
}
},
"seriesOverrides": [],
"spaceLength": 10,
"span": 12,
"stack": false,
"steppedLine": false,
"targets": [
{
"application": {
"filter": ""
},
"expr": "rate(wmi_net_bytes_sent_total{instance=~\"$server\"}[$interval]) >0",
"format": "time_series",
"functions": [],
"group": {
"filter": ""
},
"hide": false,
"host": {
"filter": ""
},
"intervalFactor": 1,
"item": {
"filter": ""
},
"legendFormat": "Sent {{nic}}",
"metric": "mysql_global_status_questions",
"mode": 0,
"options": {
"showDisabledItems": false
},
"refId": "B",
"step": 10
},
{
"application": {
"filter": ""
},
"expr": "- rate(wmi_net_bytes_received_total{instance=~\"$server\"}[$interval]) <0",
"format": "time_series",
"functions": [],
"group": {
"filter": ""
},
"hide": false,
"host": {
"filter": ""
},
"intervalFactor": 1,
"item": {
"filter": ""
},
"legendFormat": "Received {{nic}}",
"metric": "mysql_global_status_questions",
"mode": 0,
"options": {
"showDisabledItems": false
},
"refId": "A",
"step": 10
}
],
"thresholds": [],
"timeFrom": null,
"timeShift": null,
"title": "Network",
"tooltip": {
"shared": false,
"sort": 2,
"value_type": "individual"
},
"type": "graph",
"xaxis": {
"buckets": null,
"mode": "time",
"name": null,
"show": true,
"values": []
},
"yaxes": [
{
"format": "short",
"label": null,
"logBase": 1,
"max": null,
"min": null,
"show": true
},
{
"format": "short",
"label": null,
"logBase": 1,
"max": null,
"min": null,
"show": true
}
]
}
],
"repeat": null,
"repeatIteration": null,
"repeatRowId": null,
"showTitle": false,
"title": "Dashboard Row",
"titleSize": "h6"
},
{
"collapse": false,
"height": 436,
"panels": [
{
"aliasColors": {},
"bars": false,
"dashLength": 10,
"dashes": false,
"datasource": "Kram",
"fill": 1,
"hideTimeOverride": false,
"id": 10,
"legend": {
"alignAsTable": true,
"avg": false,
"current": true,
"max": true,
"min": false,
"rightSide": false,
"show": true,
"total": false,
"values": true
},
"lines": true,
"linewidth": 1,
"links": [],
"nullPointMode": "null as zero",
"percentage": false,
"pointradius": 5,
"points": false,
"renderer": "flot",
"repeat": "server",
"scopedVars": {
"server": {
"selected": true,
"text": "seinu1003:9182",
"value": "seinu1003:9182"
}
},
"seriesOverrides": [],
"spaceLength": 10,
"span": 12,
"stack": false,
"steppedLine": false,
"targets": [
{
"application": {
"filter": ""
},
"expr": "irate(wmi_net_packets_outbound_discarded{instance=~\"$server\", nic!~\"isatap.+\"}[$interval]) + irate(wmi_net_packets_outbound_errors{instance=~\"$server\"}[$interval])",
"format": "time_series",
"functions": [],
"group": {
"filter": ""
},
"hide": false,
"host": {
"filter": ""
},
"intervalFactor": 1,
"item": {
"filter": ""
},
"legendFormat": "Sent {{nic}}",
"metric": "mysql_global_status_questions",
"mode": 0,
"options": {
"showDisabledItems": false
},
"refId": "B",
"step": 15
},
{
"application": {
"filter": ""
},
"expr": "irate(wmi_net_packets_received_discarded{instance=~\"$server\", nic!~\"isatap.+\"}[$interval]) + irate(wmi_net_packets_received_errors{instance=~\"$server\"}[$interval])",
"format": "time_series",
"functions": [],
"group": {
"filter": ""
},
"hide": false,
"host": {
"filter": ""
},
"intervalFactor": 1,
"item": {
"filter": ""
},
"legendFormat": "Received {{nic}}",
"metric": "mysql_global_status_questions",
"mode": 0,
"options": {
"showDisabledItems": false
},
"refId": "A",
"step": 15
}
],
"thresholds": [],
"timeFrom": null,
"timeShift": null,
"title": "Network discarded/error packets",
"tooltip": {
"shared": false,
"sort": 2,
"value_type": "individual"
},
"type": "graph",
"xaxis": {
"buckets": null,
"mode": "time",
"name": null,
"show": true,
"values": []
},
"yaxes": [
{
"format": "short",
"label": null,
"logBase": 1,
"max": null,
"min": null,
"show": true
},
{
"format": "short",
"label": null,
"logBase": 1,
"max": null,
"min": null,
"show": true
}
]
}
],
"repeat": null,
"repeatIteration": null,
"repeatRowId": null,
"showTitle": false,
"title": "Dashboard Row",
"titleSize": "h6"
}
],
"schemaVersion": 14,
"style": "dark",
"tags": [
"windows",
"wmi_exporter",
"prometheus"
],
"templating": {
"list": [
{
"auto": false,
"auto_count": 500,
"auto_min": "30s",
"current": {
"text": "60s",
"value": "60s"
},
"hide": 2,
"label": "Interval",
"name": "interval",
"options": [
{
"selected": true,
"text": "60s",
"value": "60s"
}
],
"query": "60s",
"refresh": 2,
"type": "interval"
},
{
"allValue": null,
"current": {
"selected": true,
"text": "seinu1003:9182",
"value": "seinu1003:9182"
},
"datasource": "Kram",
"hide": 0,
"includeAll": true,
"label": "Server",
"multi": true,
"name": "server",
"options": [],
"query": "label_values(wmi_system_system_up_time, instance)",
"refresh": 1,
"regex": "",
"sort": 0,
"tagValuesQuery": "",
"tags": [],
"tagsQuery": "",
"type": "query",
"useTags": false
}
]
},
"time": {
"from": "now-1h",
"to": "now"
},
"timepicker": {
"refresh_intervals": [
"5s",
"10s",
"30s",
"1m",
"5m",
"15m",
"30m",
"1h",
"2h",
"1d"
],
"time_options": [
"5m",
"15m",
"1h",
"6h",
"12h",
"24h",
"2d",
"7d",
"30d"
]
},
"timezone": "browser",
"title": "Windows Node",
"version": 16
}